February 1 - 28, 2025: Issue 639


Annual Climate Statement Shows  australia's climate in 2024 was 2nd warmest on record - Australia’s ocean surface was the hottest on record 

On Thursday January 6, 2025 the Bureau of Meteorology released its official record of Australia's climate, water and notable weather events for 2024.

The Annual Climate Statement 2024 outlines the climate conditions across Australia in 2024. It includes information on temperature, rainfall, water resources, oceans, atmosphere and notable weather events.

The report confirms that 2024 was Australia's second-warmest and eighth-wettest year on record and our ocean surfaces were the hottest ever recorded.

Climatology Specialist Nadine D’Argent said that it was warmer than average throughout the year across most of the country.

“Nationally, spring was the warmest on record, winter was the second warmest on record and summer 2023–24 was the third warmest on record,” Ms D’Argent said.

“It was the wettest year since 2011, with overall rainfall 28% above average,” Ms D’Argent said.

“Tropical cyclones brought heavy rainfall to northern parts of Australia early in the year, where there was major flooding.”

“While much of northern Australia and some inland areas had above average rainfall, it was much drier than usual in Victoria, parts of South Australia and some parts of the west.”

These dry conditions and low inflows led to reduced water storage levels in some southern regions, including the Murray–Darling Basin. However, Australia's total surface water storage volume was just under 73% at the end of 2024, which was similar to the end of the previous year.

Ms D’Argent said Australia's climate is influenced by global patterns in the oceans and atmosphere.

“Sea surface temperatures in the Australian region, as well as globally, were the warmest on record in 2024,” Ms D’Argent said.

“Warmer oceans can increase the amount of moisture available for rainfall in our weather systems.”

Globally, 2024 was the warmest year on record and the warming in Australia is consistent with global trends.

Further information about the impact of long-term climate trends is available in the State of the Climate 2024 released by the Bureau and CSIRO in October 2024.

Important climate indicators in 2024

  • Annual sea surface temperatures for the Australian region for 2024 were the warmest on record, and 0.89 °C above the 1961–1990 average.
  • Sea surface temperatures for the Australian region for each month in 2024 were among their respective top 3 warmest on record, with 5 months being their warmest on record.
  • Global sea surface temperatures in 2024 were the warmest on record.
  • Similar to 2023, Antarctic sea-ice extent was very much below average or close to record low levels for much of the year but returned to average in December.
  • Frequent slow-moving high pressure systems in the Great Australian Bight and Tasman Sea were a major feature of atmospheric circulation in the Australian region in 2024.
  • El Niño eased in early 2024 with a return to neutral El Niño–Southern Oscillation conditions in the tropical Pacific in April.
  • The Indian Ocean Dipole was positive early in 2024 and returned to neutral conditions for much of the year.
  • The Southern Annular Mode was positive at times during the year, with prolonged negative phases from late July to mid-August and for much of December.
  • Following large and long-lasting ozone holes from 2020 to 2023, the Antarctic ozone hole in 2024 was the smallest since 2019 and developed later than any year since 2015.
  • Concentrations increased in 2024 of all the major long-lived greenhouse gases in the atmosphere, including carbon dioxide and methane.

Facts at a glance:

  • 2024 was Australia's second-warmest year on record. Australia's warmest year on record was 2019.
  • The national annual average temperature was 1.46 °C warmer than the long-term average and the warmest since 2019.
  • Annual average temperatures were warmer than average for every state and the Northern Territory.
  • Both national average maximum and minimum temperatures for the year were above average. The national average minimum temperature for the year was 1.43 °C warmer than the long-term average, making it the warmest annual minimum on record.
  • Australia's overall average rainfall was 596 mm, which is 28% above average.
  • Rainfall across northern Australia was 42% above average, making it the fifth-wettest year on record.
  • Rainfall across parts of southern Australia was below average.
  • Annual sea surface temperatures for the Australian region were the warmest on record.

For the full analysis and report on last year's temperature, rainfall, water resources, climate influences and more:

State and territory information

Queensland

  • Queensland overall had 768 mm of rainfall in 2024, which is 23% above average.
  • Rainfall was above average to very much above average for large parts of Queensland, and below average for small parts of the state's interior and central coast.
  • The annual average temperature for Queensland was 1.63 °C warmer than the long-term average, making 2024 Queensland's warmest year on record.

New South Wales (and the ACT)

  • New South Wales overall had 581 mm of rainfall in 2024, which is 4% above average.
  • Rainfall was above average to very much above average for inland areas of New South Wales, and below average for the south-eastern part of the state.
  • The annual average temperature for New South Wales was 1.55 °C warmer than the long-term average, making 2024 the third-warmest year on record for New South Wales.

Victoria

  • Victoria overall had 529 mm of rainfall in 2024, which is 20% below average.
  • Rainfall was below average to very much below average for most of Victoria.
  • The annual average temperature for Victoria was 1.08 °C warmer than the long-term average, making 2024 Victoria's equal fifth-warmest year on record.

Tasmania

  • Tasmania overall had 1269 mm of rainfall in 2024, which is 6% below average.
  • Rainfall was below average to very much below average for western and southern coastal areas of Tasmania.
  • The annual average temperature for Tasmania was 0.77 °C warmer than the long-term average, making 2024 Tasmania's equal fifth-warmest year on record.

South Australia

  • South Australia overall had 218 mm of rainfall in 2024, which is 3% below average.
  • Rainfall was above average to very much above average for western and north-eastern parts of South Australia, but below average to very much below average for southern and south-eastern areas of the state.
  • The annual average temperature for South Australia was 1.60 °C warmer than the long-term average, making 2024 South Australia's second-warmest year on record. South Australia's warmest year on record was 2013.

Western Australia

  • Western Australia overall had 461 mm of rainfall in 2024, which is 35% above average.
  • Rainfall was above average to very much above average for most of Western Australia, but below average to very much below average for parts of coastal south-west and north-west Western Australia.
  • The annual average temperature for Western Australia was 1.57 °C warmer than the long-term average, making 2024 Western Australia's second-warmest year on record. Western Australia's warmest year on record was 2019.

Northern Territory

  • The Northern Territory overall had 898 mm of rainfall in 2024, which is 65% above average.
  • Rainfall was above average to very much above average for most of the Northern Territory.
  • Annual rainfall for the Northern Territory was the fourth highest on record, with the highest recorded being in 1974 with 1007 mm.
  • The annual average temperature for the Northern Territory was 0.95 °C warmer than the long-term average. 2024 was Northern Territory's equal 11th-warmest year on record.

It’s official: Australia’s ocean surface was the hottest on record in 2024

Moninya Roughan, UNSW Sydney

Australia’s sea surface temperatures were the warmest on record last year, according to a snapshot of the nation’s climate which underscores the perilous state of the world’s oceans.

The Bureau of Meteorology on Thursday released its annual climate statement for 2024 – the official record of temperature, rainfall, water resources, oceans, atmosphere and notable weather.

Among its many alarming findings were that sea surface temperatures were hotter than ever around the continent last year: a whopping 0.89°C above average.

Oceans cover more than 70% of Earth’s surface, and their warming is gravely concerning. It causes sea levels to rise, coral to bleach and Earth’s ice sheets to melt faster. Hotter oceans also makes weather on land more extreme and damages the marine life which underpins vital ocean ecosystems.

What the snapshot showed

Australia’s climate varies from year to year. That’s due to natural phenomena such as the El Niño and La Niña climate drivers, as well as human-induced climate change.

The bureau confirmed 2024 was Australia’s second-warmest year since national records began in 1910. The national annual average temperature was 1.46°C warmer than the long-term average (1961–90). Heatwaves struck large parts of Australia early in the year, and from September to December.

Average rainfall in Australia was 596 millimetres, 28% above the 30-year average, making last year the eighth-wettest since records began.

And annual sea surface temperatures for the Australian region were the warmest on record. Global sea surface temperatures in 2024 were also the warmest on record.

According to the bureau, Antarctic sea-ice extent was far below average, or close to record-lows, for much of the year but returned to average in December.

What caused the hot oceans?

It’s too early to officially attribute the ocean warming to climate change. But we do know greenhouse gas emissions are heating the Earth’s atmosphere, and oceans absorb 90% of this heat.

So we can expect human-induced climate change played a big role in warming the oceans last year. But shorter-term forces are at play, too.

The rare triple-dip La Niña Australia experienced from 2020 to 2023 brought cooler water from deep in the ocean up to the surface. It was like turning on the ocean’s air-conditioner.

But that pattern ended and Australia entered an El Niño in September 2023. It lasted about seven months, when the oscillation between El Niño and La Niña entered a neutral phase.

The absence of a La Niña meant cool water was no longer being churned up from the deep. Once that masking effect disappeared, the long-term warming trend of the oceans became apparent once more.

Water can store a lot more heat than air. In fact, just the top few metres of the ocean store as much heat as Earth’s entire atmosphere. Oceans take a long time to heat up and a long time to cool.

Heat at the ocean’s surface eventually gets pushed deeper into the water column and spreads across Earth’s surface in currents. The below chart shows how the world’s oceans have heated over the past 70 years.

chart showing ocean warming since 1960
Changes in the world’s ocean heat content since 1955. NOAA/NCEI World Ocean Database

Why should we care about ocean warming?

Rapid warming of Earth’s oceans is setting off a raft of worrying changes.

It can lead to less nutrients in surface waters, which in turn leads to fewer fish. Warmer water can also cause species to move elsewhere. This threatens the food security and livelihoods of millions of people around the world.

Just last week, it was reported that tens of thousands of fish died off northwestern Australia due to a large and prolonged marine heatwave.

Warm water causes coral bleaching, as experienced on the Great Barrier Reef in recent decades. It also makes oceans more acidic, reducing the amount of calcium carbonate available for organisms to build shells and skeletons.

Warming oceans trigger sea level rise – both due to melt water from glaciers and ice sheets, and the fact seawater expands as it warms.

Hotter oceans are also linked to weather extremes, such as more intense cyclones and heavier rainfall. It’s likely the high annual rainfall Australia experienced in 2024 was in part due to warmer ocean temperatures.

What now?

As long as humans keep burning fossil fuels and pumping greenhouse gases into the atmosphere, the oceans will keep warming.

Unfortunately, the world is not doing a good job of shifting its emissions trajectory. As the bureau pointed out in its statement, concentrations of all major long-lived greenhouse gases in the atmosphere increased last year, including carbon dioxide and methane.

Prolonged ocean warming is driving changes in weather patterns and more frequent and intense marine heatwaves. This threatens ecosystems and human livelihoods. To protect our oceans and our way of life, we must transition to clean energy sources and cut carbon emissions.

At the same time, we must urgently expand ocean observing below the ocean’s surface, especially in under-studied regions, to establish crucial baseline data for measuring climate change impacts.

The time to act is now: to reduce emissions, support ocean research and help safeguard the future of our blue planet.The Conversation

Moninya Roughan, Professor in Oceanography, UNSW Sydney

This article is republished from The Conversation under a Creative Commons license. Read the original article.

From Week One February 2025 (January 27 - February 2) Environment News, Issue 639:

A marine heatwave in northwest Australia is killing huge numbers of fish. It’s heading south

Ningaloo Reef is facing the heat. James C. Farr/Shutterstock
Sina PinterThe University of Western AustraliaMatt RaysonThe University of Western Australia, and Nicole L. JonesThe University of Western Australia

Tens of thousands of fish have died off northwestern Australia, as a large and long-lasting marine heatwave intensifies.

The fish kill at Gnoorea Beach near Karratha is concerning our team of scientists, as the hot mass of water heads south towards Ningaloo Reef and the seagrass gardens in Shark Bay. That’s because we’ve seen this before. An enormous marine heatwave in 2010-11 devastated fisheries and ecosystems further down the WA coast.

This marine heatwave began in September, with temperatures up to 3°C warmer than usual off Broome. There’s no end in sight.

The heatwave comes as oceans worldwide experience recordbreaking heat, driven by climate change. More than 90% of all heat trapped by greenhouse gases goes into the oceans.

The fish kill is a visible way to glimpse a disaster often out of sight and out of mind. But these marine heatwaves do much more, from wiping out seagrass meadows and kelp beds to trashing fisheries.

Up to 30,000 dead fish have washed up around Gnoorea Beach near Karratha. WA Department of Primary Industries and Regional Development

How bad is this marine heatwave?

Marine heatwaves are periods of at least five consecutive days when ocean temperatures are significantly higher than the long-term average for the region and season.

Since September 2024, temperatures off Australia’s northwest coast have been high enough to be considered a heatwave.

In late December, the area of hotter water expanded southward along the Pilbara coast and became more intense. Temperatures hit 4–5°C above normal at the surface. Our research group has gathered data from satellite measurements, which tells us it’s hotter than usual. Data from autonomous ocean gliders also show unusual levels of heat as far down as 200 metres.

In January, this heatwave has become bad enough to be classified in some areas as a severe marine heatwave.

There’s no relief in sight yet. The Bureau of Meteorology forecasts marine heatwave conditions to continue through February.

figure showing intensity of marine heatwave in northwest Western Australia
On the left, the marine heatwave on the Northwest Shelf is visible in dark red. On the right, the intensity of the heatwave is shown over time on the Northwest Shelf and further south in Central Western Australia. Author providedCC BY

Will it be worse than the 2010 heatwave?

The current marine heatwave is, so far, the second-worst in Western Australia’s recorded history.

Over the 2010–11 summer, a severe marine heatwave devastated seas off the state. Temperatures hit up to 5°C above average, peaking in February and March.

The worst-hit areas were seas off the central West Australian coastline, leaving those to the north largely unaffected. But the heatwave stretched 2,000 kilometres, from the Pilbara all the way down to Denmark in the southwest.

The reason the 2010 heatwave spread so far south was due to the Leeuwin Current, which was stronger than usual due to weak southerly winds linked to a low pressure system off the coast.

figure showing the 2010-11 marine heatwave in Western Australia
The 2010-11 marine heatwave hit Central West Australian waters hardest. The Leeuwin Current ferried heat southward. Author providedCC BY

The heat led to local extinction of kelp species along a 100km stretch of coastline. Scallop and blue swimmer crab fisheries had to close. Seagrass meadows in Shark Bay collapsed. Tropical species were sighted in new areas. And coral bleached at Ningaloo.

By contrast, this current marine heatwave has concentrated on the northern coastline, but may spread south in coming weeks.

Unfortunately, there are strong similarities between the 2010–11 heatwave and this one. Both occurred during a La Niña year.

A similar low pressure system in December 2024 weakened southerly winds during this heatwave, though not as pronounced as in 2010-11. We can expect to see the Leeuwin Current intensify and carry more warm water than usual south, but perhaps not as far as in 2010–11.

Weather systems at present are developing slightly differently to 2010–11, but they could still lead to weaker southerly winds and produce a stronger current channelling heat.

What does this mean for ocean life?

Marine heatwaves at this size and intensity can profoundly damage marine ecosystems and fisheries. The Karratha fish kill is the most visible sign of ecosystem distress.

We have already seen signs of bleaching in the coral reefs of the Kimberley region, while corals are experiencing heat stress at world-famous Ningaloo Reef.

The heat is now affecting the Gascoyne region between Carnarvon and Exmouth, and is likely to head further south.

Damage from the heatwave could threaten valuable industries such as the rock lobster fishery and marine tourism on the Coral Coast.

bleached coral linked to marine heatwave.
Bleached corals in Cygnet Bay north of Broome. Photo taken on 16th January. Kayleigh FosteCC BY

More heatwaves will come

As the climate changes, modelling indicates marine heatwaves will hit more often and to intensify.

Worldwide, marine heatwaves have devastated ecosystems. One of the worst, the Pacific “blob” heatwave of 2014-2016, killed an estimated 100 million Pacific cod and four million birds from a single seabird species, as well as contributing to the starvation of about 7,000 humpback whales. The intense heat killed off cold-loving species and paved the way for tropical species to enter and even thrive.

Right now, 28% of the world’s oceans are in heatwave conditions, based on surface temperatures.

While there is a clear link between the 2010-11 marine heatwave and climate change, we cannot conclusively say this current heatwave off Western Australia is linked to climate change.

That’s because we don’t have enough data about what’s happening under the surface. Temperatures in the ocean vary greatly by depth, and a hot surface doesn’t always mean heat has reached deeper water.

So while we know a marine heatwave is in progress, we don’t know how bad it is or how far down the heat has reached in different regions. We need better ways to measure temperatures at depth, to be able to gauge how bad a heatwave is. Installing more temperature sensors along the WA coastline would allow us to better monitor and respond to temperature extremes.

The earlier we know about a heatwave, the more we can do to prepare. The 2010-2011 heatwave made many people aware of what damage heat can do to an ocean, as fishing boats sat idle and tourists steered clear of dying coral.

More, and worse, is likely to come. Better conservation and management of our oceans can help. But tackling the root cause of intensifying heat – unchecked greenhouse gas emissions – is still far and away the most important challenge.The Conversation

Sina Pinter, PhD Candidate in Ocean Dynamics, The University of Western AustraliaMatt Rayson, Senior Research Fellow in Oceanography, The University of Western Australia, and Nicole L. Jones, Professor of Physical Oceanography, The University of Western Australia

This article is republished from The Conversation under a Creative Commons license. Read the original article.

WA Government approves Woodside’s North West Shelf gas expansion 

December 13, 2024

The Western Australian Government’s approval to extend the operation of Woodside’s massive North West Shelf gas project for another half century is a reckless decision that jeopardises global efforts to combat climate change and flies in the face of the Australian Government’s commitment to net zero emissions by 2050, the Australian Marine Conservation Society said on December 13 2024.

The North West Shelf extension is a cornerstone of the Burrup Hub, which would be one of the dirtiest carbon polluting projects in Australia, projected to emit billions of tonnes of greenhouse gases over its lifespan. 

The final decision now lies with federal Environment Minister Tanya Plibersek.

AMCS WA Director Paul Gamblin said: “The WA Government’s decision undermines Australia’s climate commitments and exacerbates the escalating impacts of climate change. It defies logic to expand a massive fossil fuel project for another half century when the world must drastically cut emissions to reach net zero by 2050. 

“Globally we are witnessing record high temperatures and devastating impacts on marine ecosystems. The Great Barrier Reef is reeling from repeated coral bleaching events, and WA’s Ningaloo Reef has suffered bleaching in recent years. 

“Enabling this extension also puts Scott Reef – Australia’s largest offshore coral reef – at severe risk. Drilling would occur very close to this extraordinary marine wonder. Governments have come under intense pressure from pro-gas interests to allow drilling around this coral reef to feed vast quantities of fossil gas into its North West Shelf processing plant.

“Approval of Woodside’s Burrup Hub would risk further major damage to UNESCO World Heritage-nominated rock art on Murujuga from acid gas pollution.

“Corporate interests are once again taking precedence over environmental and cultural protection, and community wellbeing. The Albanese government now faces a critical test of its climate commitments: will it side with fossil fuel corporations or act decisively in the public’s interest? 

“This massive fossil fuel project is an environmental risk we simply cannot take. Allowing this project to proceed will lock Australia into decades of additional climate pollution, while the rest of the world moves towards renewable energy. It is time for our leaders to chart a sustainable course that prioritises our planet’s future.”

AMCS Patron Tim Winton and WA Director Paul Gamblin recently visited Scott Reef as part of an expedition to highlight the ecological significance of this region. The proposed Browse Basin (Scott Reef) project, which would feed the North West Shelf extension, includes drilling 50 gas wells dangerously close to this extraordinary coral ecosystem. 

WA Director Paul Gamblin and AMCS Patron Tim Winton. Photo: Nush Freedman photogarphy/ACMS

Monitoring the Common Murre Mass Mortality in Coastal Alaska

by U.S. Fish & Wildlife Service

Sentinels of ocean health: counting a climate catastrophe

Common murres help us understand the health of Alaska's marine ecosystems – and sound a warning when there is trouble below the waves.  

Murres are especially sensitive to changes in their food supply because they must eat a significant portion of their body weight each day to survive and respond quickly to changes in food availability. These seabirds dive up to 200 meters deep to catch small schooling fish like capelin and sand lance. When schooling fish become scarce or scattered, common murres struggle to meet their high energy demands, making them good indicators of broader changes in ocean conditions.

Working with partners, the U.S. Fish and Wildlife Service’s Alaska Maritime National Wildlife Refuge, has recently published a comprehensive study of the Alaska death toll in common murres that resulted from a significant marine heatwave in 2014-16.

Through an analysis of long-term monitoring data covering two large Alaska ecosystems, we found that the mass mortality event was several times greater than initially estimated. About half of Alaska’s common murre population – around four million birds – perished, the largest single-species wildlife die-off ever documented in modern history.

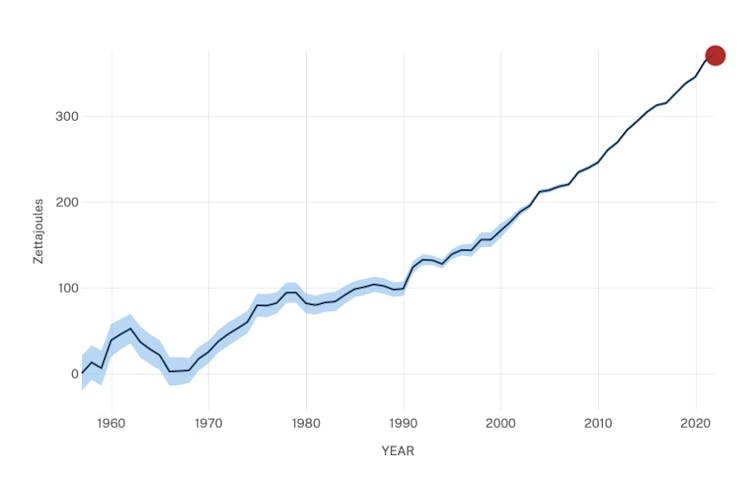
This is the first study to show that the impacts of rising temperatures, due to climate change , can be swift, intense, and long-lasting, with no recovery in sight and potentially permanent ecosystem changes.

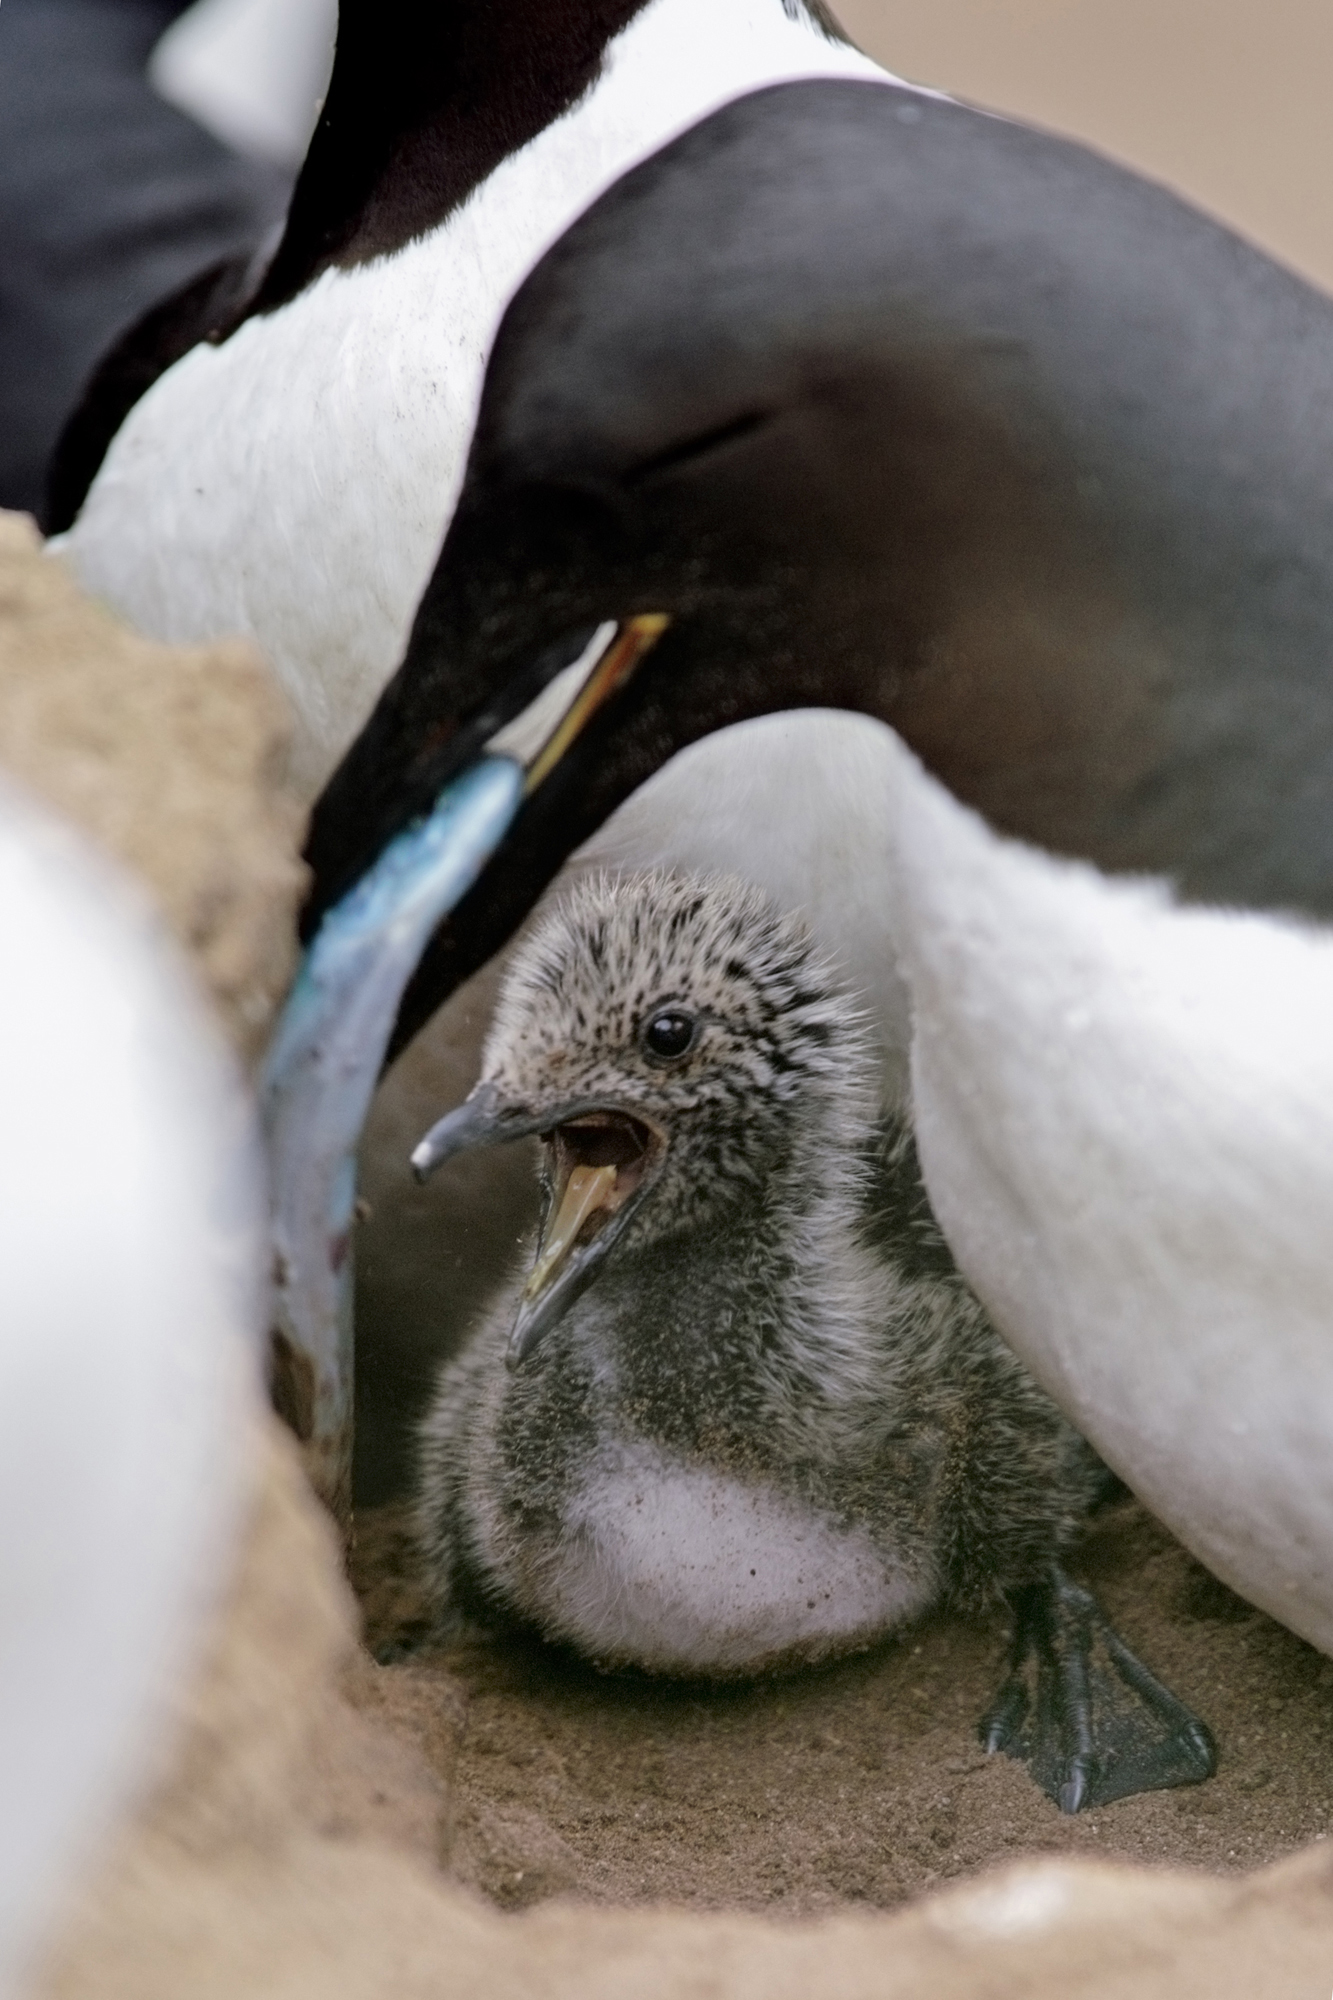
A common murre feeds a small fish to a chick. Photo By/Credit: Cornelius Nelo Schlawe/USFWS

Documenting an unprecedented event

A healthy murre colony overwhelms the senses. Thousands of black-and-white bodies crowd the cliffs, their constant cooing and grumbling creating a wall of sound. Birds move continuously — flying to and from fishing grounds, trading nest duties with mates, or bringing fish to chicks. But during the summers of 2015 and 2016, these typically bustling cliffs fell eerily quiet.

In late 2014, a major marine heatwave—a period of abnormally warm ocean temperatures—began in Alaska's waters. Known as “The Blob,” this warming persisted for two years, disrupting marine food webs. The impact became visible as more than 62,000 emaciated common murre carcasses washed ashore from California to Alaska – most washing up within the Gulf of Alaska. At the same time, biologists also recorded severely reduced numbers at every nesting colony they visited across the Gulf of Alaska and Bering Sea, including 22 complete reproductive failures at colony sites between 2015 and 2017.

Biologists could only guess whether the birds had died, relocated, or simply lacked the energy to breed. In the years immediately following the heatwave, the murres did return and began to breed again – but in much lower numbers.

Studies show that only a fraction of birds that die at sea typically wash ashore. Biologists estimated in a 2020 paper that total mortality from the heatwave was 500,000 to approaching 1 million birds. 

“We knew right away this was a big, unprecedented die-off,” says Heather Renner, supervisory biologist, Alaska Maritime National Wildlife Refuge. “However, we had no confident way to make a final estimate based on the carcasses alone. We needed colony population count data over several years to be able to determine how many birds were really lost.”

*Read more: "Extreme Mortality and Reproductive Failure of Common Murres Resulting from the Northeast Pacific Marine Heatwave of 2014-2016." PLOS ONE 15, no. 1 (January 15, 2020).

The network of warning signs

The staff at Alaska Maritime National Wildlife Refuge work with partners to maintain a seabird monitoring network with more than 50 years of continuous data collection. Together, these sites span colonies ranging from hundreds to hundreds of thousands of birds across an enormous geographical area. This baseline data allows us to assess fluctuations as normal or unusual, and proved critical in understanding the dramatic loss of common murres.

In the years before the heatwave, common murre populations increased at some colonies and decreased at others. During the heatwave, all colonies suffered major losses. It was a remarkably clear, consistent signal at all monitored colonies within both the Gulf of Alaska and the Bering Sea ecosystems.

In subsequent years, information collected by the monitoring network suggested that something fundamental had changed for common murres, and perhaps for the larger ecosystem.

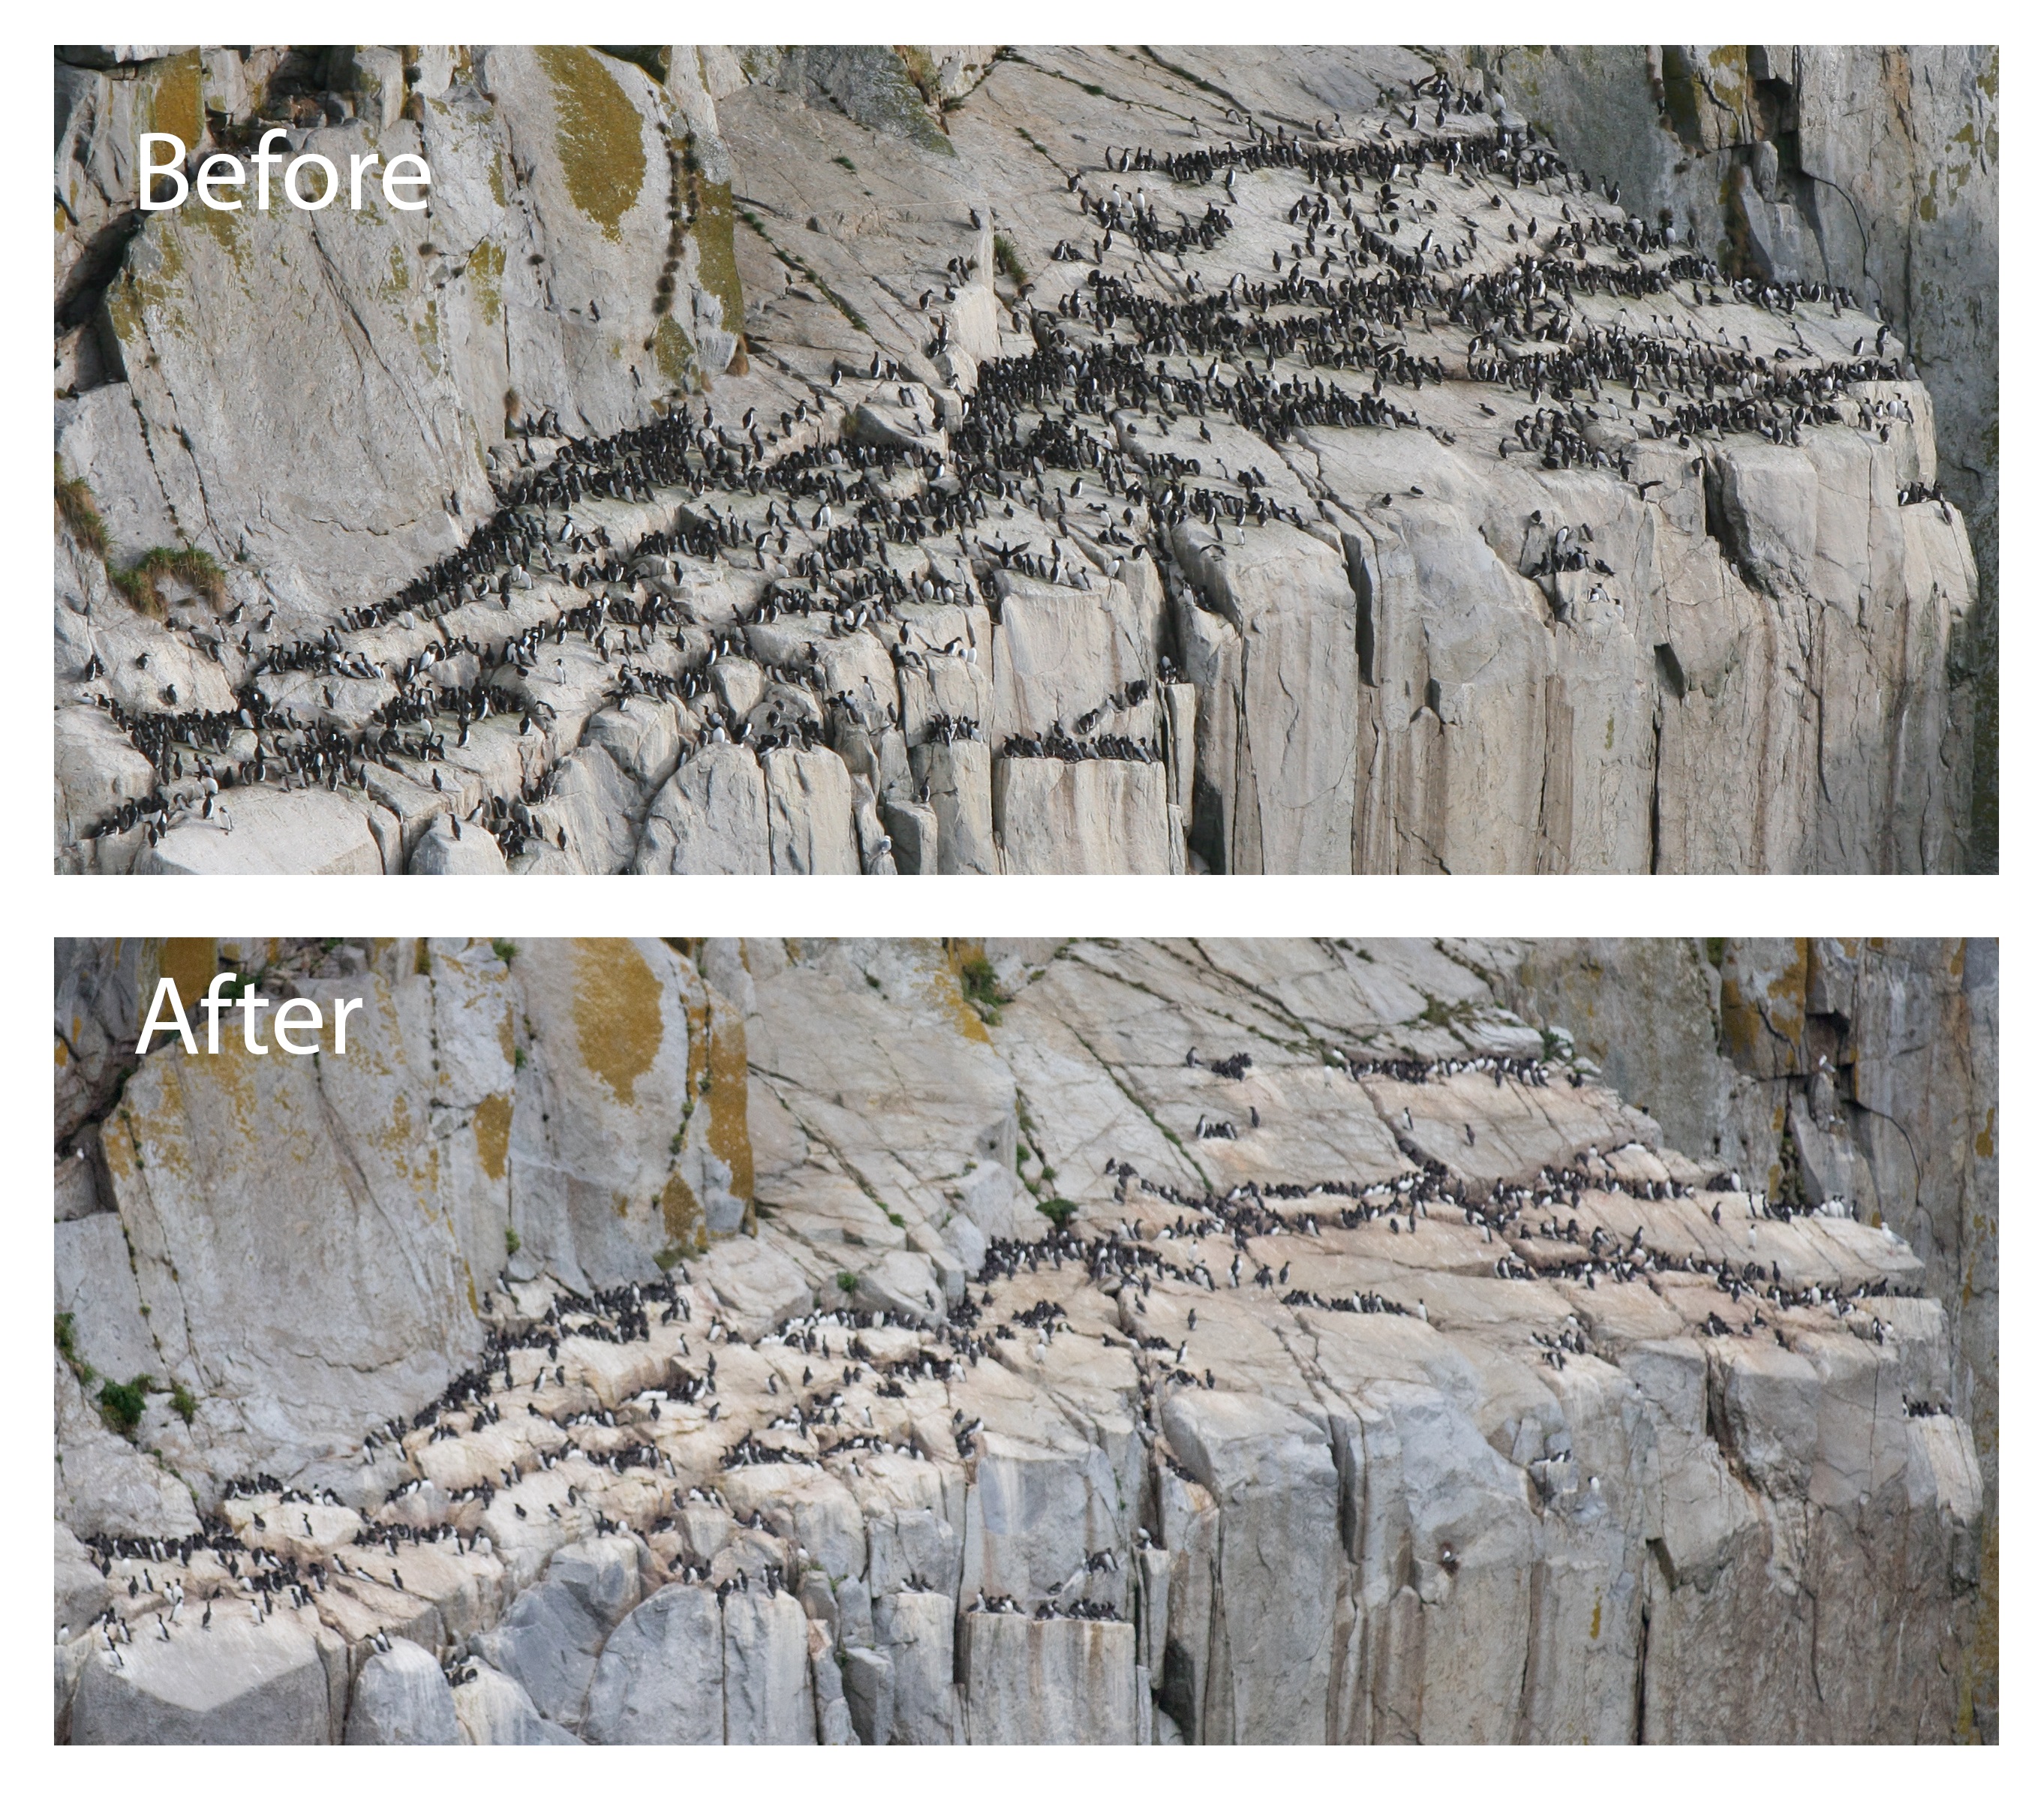
Before and after comparison of a common murre colony in the Semidi Islands. The top photo shows the colony in 2014, the bottom photo shows the colony in 2021. Photo By/Credit: USFWS

Missing murres: studying the impacts

We were waiting for the birds to show back up.” Heather Renner

During the seven years of monitoring after the heatwave, biologists expected to see some recovery for the murres as ocean conditions stabilised and nest success could improve. Instead, their numbers have remained far lower than before across all colonies.

In response to the continued low populations at all of the known monitoring sites, refuge staff began working with a team of collaborators to analyse the monitoring data collected over the past 14 years. Research collaborators included:

  • U.S. Fish and Wildlife Service Alaska Region Inventory and Monitoring Program
  • University of Washington
  • U.S. Geological Survey
  • Tern Again Consulting 

The team looked at data from 13 colony sites spread over two large ecosystems in the Gulf of Alaska and Bering Sea. Monitoring and data collection contributors included:

  • Alaska Maritime National Wildlife Refuge
  • Alaska Peninsula and Becharof National Wildlife Refuges
  • Togiak National Wildlife Refuge
  • Round Island, monitored by the State of Alaska, Department of Fish and Game
  • Middleton Island, supported by GulfWatch and the Institute for Seabird Research and Conservation

A climate tragedy emerges: four million murres lost

This research and analysis, recently published in the journal, Science, in December 2024 as "Catastrophic and persistent loss of common murres after a marine heatwave," details the full extent of the loss, a mortality four to eight times worse than the initial estimate.

About half of Alaska’s common murre population – around four million birds – died during the marine heatwave.

To understand the magnitude of this event: the murre die-off was approximately fifteen times larger than the number of seabirds killed during the Exxon Valdez oil spill, making it the largest single-species wildlife die-off ever documented.

This is the first study to show that impacts of rising temperatures, due to climate change, can be swift, intense, and long-lasting, with no recovery in sight and potentially permanent ecosystem changes. The sustained reduction in murre populations suggests a fundamental shift in carrying capacity—the ability to support healthy seabird populations. Smaller murre colonies may now face increased vulnerability to predators and environmental stresses, further complicating their recovery.

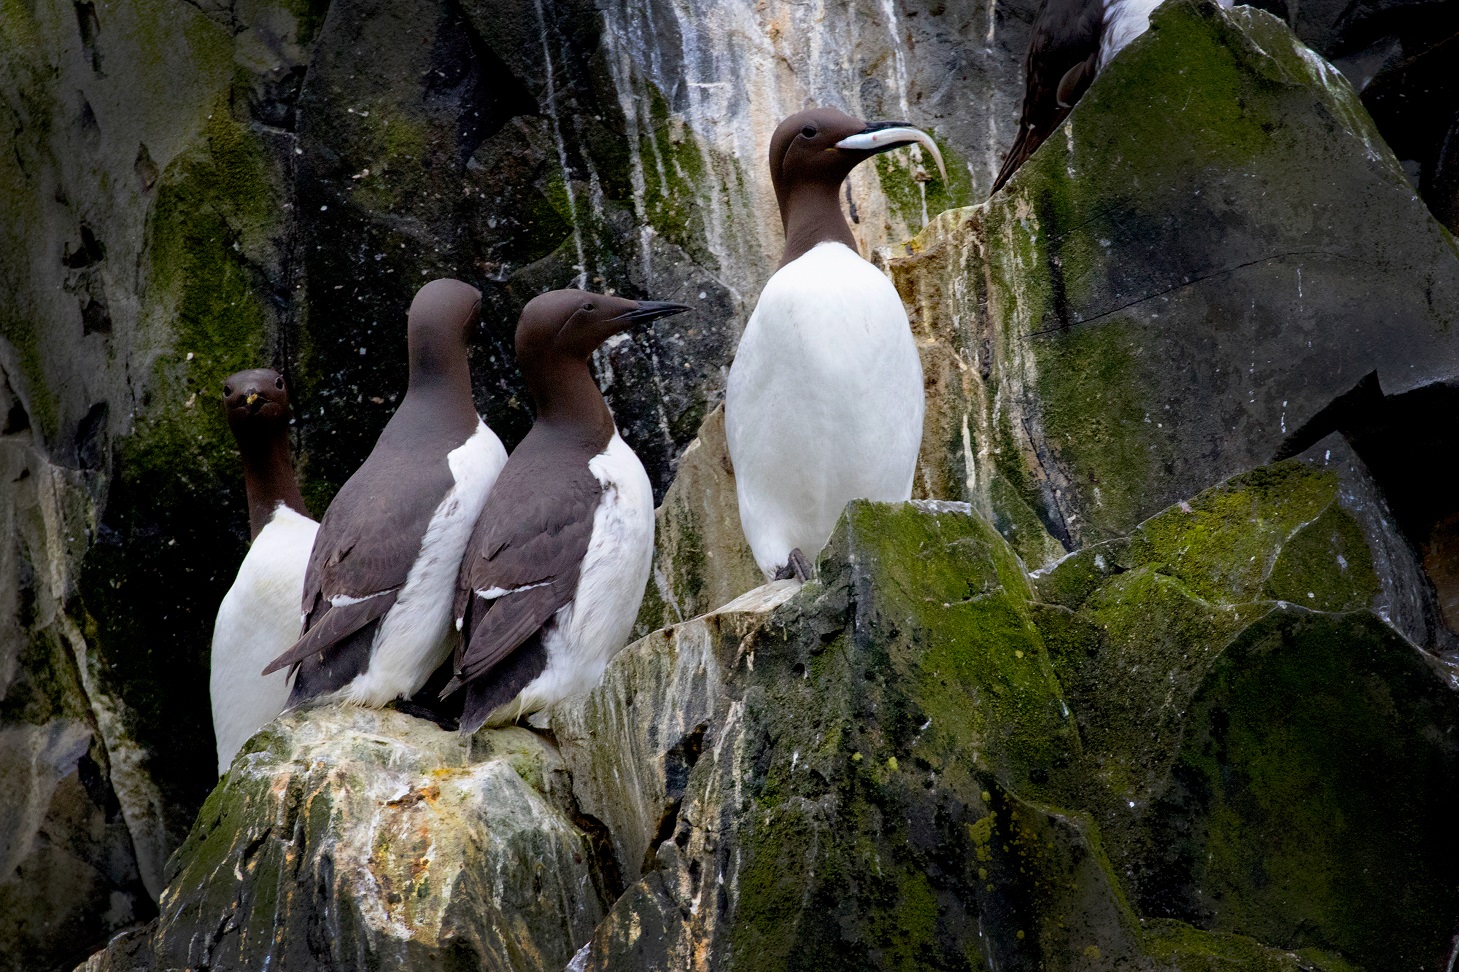
Common murre with a small fish perched with other murres on a cliff ledge. Photo By/Credit: Brie Drummond/USFWS

Falling dominoes: disrupting the marine ecosystem

The murre die-off was part of a larger disruption in the marine food web. Pacific cod populations crashed by 80%, leading to fishery closures, while other forage fish like capelin—a crucial prey species—declined dramatically. These cascading effects rippled through the ecosystem, impacting both wildlife and the fishing communities that depend on healthy marine resources. 

For Alaska Native communities, massive die-offs like this one may also disrupt a centuries-old cultural relationship with marine life. Murres have traditionally been an important subsistence resource in many coastal communities, both for meat and eggs, making their sustained low numbers a potential challenge for traditional harvesting practices and cultural connections.

However, the monitoring data also showed that some marine species, such as thick-billed murres, were more resilient during the die-off. The 2024 study theorizes that the heatwave affected the food web at pinch points critical to some species, rather than impacting all marine life consistently.

Looking Forward

The lasting loss of Alaska's common murres demonstrates both the vulnerability of marine ecosystems, due to climate change, and the critical importance of long-term monitoring in understanding these changes. 

Species populations naturally fluctuate over time. Our 50-year dataset allows us to distinguish between normal variations and significant changes that require action. While long-term monitoring may have long gaps between major discoveries like this one, without it, these critical ecological changes might go undetected and unexplained.

The refuge staff will continue to work with partners to maintain the long-term monitoring for key seabird species across coastal Alaska. With this information, we can provide:

  • Early warning of marine ecosystem changes
  • Data for wildlife management decisions
  • Understanding of climate impacts on marine systems
  • Support for coastal community planning
  • Context for fisheries management

Through careful and rigorous analysis of monitoring information, such as the recent study documenting the murre die-off, we strive to better understand and protect the ocean ecosystems that support both wildlife and human communities.

More about common murres

Monitoring:

During the summer months, common murres nest directly on cliff ledges, laying distinctively pointed eggs that resist rolling off—often alongside thick-billed murres and other seabird species. Common murres are ideal for long-term monitoring because they return to the same nesting sites each year and can be studied across an enormous geographic range. They are the only seabird species we can consistently monitor at all of our refuge study sites, making them invaluable for understanding broad-scale changes in ocean conditions.

Our core sites:

Eight long-term seabird monitoring locations across the expanse of the refuge, staffed seasonally by 2-3 field researchers who conduct systematic data collection over 3.5-month periods each summer. To monitor common murres, teams follow nest statuses and conduct counts on designated cliff plots using binoculars and spotting scopes throughout breeding season. They document population numbers, reproductive timing, nest survival rates, and chick diet composition.

Extended Network:

The refuge also conducts shorter boat-based surveys intermittently at 10-15 additional locations interspersed between long-term monitoring sites throughout the Gulf of Alaska and Bering Sea. 

More about the 2014-16 marine heatwave event:

The 2014-2016 marine heat wave was an underwater heat dome—a vast area of unusually warm ocean temperatures that broke records dating back three decades. It was like having a heatwave on land that covered the entire West Coast and lasted for two years without reprieve. As climate change progresses, these marine heatwaves will likely increase in frequency, duration, and intensity.

_________________________________

Related: Shearwaters washing up on local beaches for third year in a row: Mass mortalities of Starving Birds attributed to Australia's Lose-Lose Policy on the Australian Environment - October 2024, Issue 636 of Pittwater Online News

Cheeseman T, Barlow J, Acebes JM, Audley K, Bejder L, Birdsall C, Bracamontes OS, Bradford AL, Byington J, Calambokidis J, Cartwright R, Cedarleaf J, Chavez AJG, Currie J, De Castro RC, De Weerdt J, Doe N, Doniol-Valcroze T, Dracott K, Filatova O, Finn R, Flynn KR, Ford J, Frisch-Jordán A, Gabriele C, Goodwin B, Hayslip C, Hildering J, Hill MC, Jacobsen JK, Jiménez-López ME, Jones M, Kobayashi N, Lammers M, Lyman E, Malleson M, Mamaev E, Loustalot PM, Masterman A, Matkin CO, McMillan C, Moore J, Moran J, Neilson JL, Newell H, Okabe H, Olio M, Ortega-Ortiz CD, Pack AA, Palacios DM, Pearson H, Quintana-Rizzo E, Barragán RR, Ransome N, Rosales-Nanduca H, Sharpe F, Shaw T, Southerland K, Stack S, Staniland I, Straley J, Szabo A, Teerlink S, Titova O, Urban-Ramirez J, van Aswegen M, Vinicius M, von Ziegesar O, Witteveen B, Wray J, Yano K, Yegin I, Zwiefelhofer D, Clapham P. Bellwethers of change: population modelling of North Pacific humpback whales from 2002 through 2021 reveals shift from recovery to climate response. Royal Society Open Science. 2024 Feb 28;11(2):231462. doi: 10.1098/rsos.231462. PMID: 38420629; PMCID: PMC10898971.

As the Black Summer megafires neared, people rallied to save wildlife and domestic animals. But it came at a real cost

Danielle CelermajerUniversity of SydneyAnna SturmanUniversity of SydneyBlanche VerlieUniversity of SydneyFreya MacDonaldUniversity of Sydney, and Natasha HeenanUniversity of Sydney

As the 2019-2020 megafires took hold across eastern Australia, many of us reeled at the sight of animals trying and often failing to flee. Our screens filled up with images of koalas with burned paws and possums in firefighter helmets.

The death toll was staggering, estimated at up to three billion wild animals killed or displaced. Millions more were severely injured. Tens of thousands of domesticated animals were killed or had to be euthanised.

In fighting these fires, authorities focused almost entirely on protecting human lives and property, other than targeted rescue efforts for the last remaining wild stand of Wollemi pine. The role of rescuing and caring for domesticated and wild animals fell almost entirely to community groups and individual carers, who stepped up to fill the gap at significant cost to themselves – financially, emotionally and sometimes even at a risk to their safety.

Our new research draws on more than 60 interviews with wildlife carers and groups in the Shoalhaven region south of Wollongong in New South Wales. These people spontaneously organised themselves to care for thousands of domesticated, farm and wild animals, from evacuating them from fire zones to giving them shelter, food, water and healthcare.

The lengths our interviewees went to were extraordinary. But these rescue efforts were largely invisible to authorities – and, as our interviewees told us, sometimes even condemned as irresponsible.

What did our interviews tell us?

The standard view in Australia is that only humans matter in the face of bushfires. But the way affected communities reached out to save as many animals as they could shows many people think we ought to be acting differently.

One interviewee told about screaming for “her babies” as Rural Fire Service firefighters evacuated her. In response, the firies searched the house for human babies to no avail. When they found out she meant her wombat joeys, they laughed in relief. But to our interviewee, the joeys were like her babies. The joeys were safe inside her house.

People cared for a wide range of species, from horses, chickens, bees and cows to native birds, possums, wombats and wallabies. Despite this, we found common themes.

Many people felt the system had let them down when it came to protecting animals. This is why many of them felt they had to take matters into their own hands to ensure that animals survived.

As one interviewee told us:

one thing that you have to realise, is people’s animals are their children, and they are their life. If you let someone think that their animal isn’t safe, they will put themselves in danger to try and get to that animal or save that animal […] That’s one thing the firies — you know, if they’re not an animal compassionate person, they don’t get that.

While some guidance on disaster preparation talks about how to protect pets such as cats and dogs, wildlife carers, farmers and horse owners often found themselves facing incoming fires with little or no information or support.

People also told us about a lack of information on how to care for different types of animals during disasters. Information was often nonexistent or hard to locate, making decision-making during the crisis very difficult.

As one farmer told us:

there’s not any information on realistically what you do with your animals in a case of […] a massive disaster. I mean, it’s like someone said about cutting the fences. But now you’ve got stocking cattle running through the bush and they don’t know where the fire’s going to turn or what’s going to happen.

The needs of animals differ significantly. It’s harder to find shelter for a horse than a smaller animal, for instance. Wildlife being cared for already need assistance, due to being orphaned, injured or ill. It’s harder to evacuate injured animals or joeys who need regular feeding than it is to evacuate healthy adult animals.

Our interviewees reported price spikes for transport, food, temporary fencing and medicines during the 2019-2020 emergency season. Caring for animals always comes with costs, but the cost burden intensified over the Black Summer and afterwards.

Caring for animals came with another cost too, to mental health. Many of our interviewees told us they still felt traumatised, even though our interviews were two or three years after the fires.

As one interviewee told us:

the people at Lake Conjola […] said it was like an apocalypse. They said there was dead birds dropping out of the sky. Kangaroos would come hopping out of the bush on fire […] I know it really heavily affected most people on the beach, the horrific things that they saw.

Despite facing a lack of formal support and with limited information, people organised themselves very quickly into networks to share access to safe land, transport, food, labour and information. Dedicated people set up social media groups to allocate tasks, call for help and so on. This unsung animal rescue effort was almost entirely driven by volunteers.

What should we do before the next megafires?

Australia will inevitably be hit by more megafires, as climate change brings more hot, dry fire weather and humidity falls over land.

What would it mean to include animals in our planning? To start with, more and better information for wildlife carers, farmers, pet owners and the wider community. It would mean directing more funds to animal care, both during and after disasters, and including animal care in local, state and federal disaster planning. It would mean improving communication networks so people know where to go.

To this end, we developed a new guide for communities wanting to be better prepared to help animals in the next disaster. We prototyped an app designed to help communities organise themselves in order to help animals during disasters.

The scale of the Black Summer fires found governments and communities largely unprepared. But we are now in a position to learn from what happened.

As authorities prepare for the next fires, they should broaden how they think about disaster preparation. Our research suggests disaster planning needs to take place at a community level, rather than a focus on individual households. And vitally, authorities need to think of communities as made up of both humans and animals, rather than just humans.The Conversation

Danielle Celermajer, Professor of Sociology and Social Policy, University of SydneyAnna Sturman, Lecturer in Human Geography, University of SydneyBlanche Verlie, Horizon Research Fellow and Lecturer in Social Science, University of SydneyFreya MacDonald, Phd student in Gender and Cultural Studies, University of Sydney, and Natasha Heenan, Casual Lecturer, Political Economy and Climate Policy, University of Sydney

This article is republished from The Conversation under a Creative Commons license. Read the original article.