Inbox and environment news: Issue 604
November 5 - 11, 2023: Issue 604
Mother Brushtail Killed On Barrenjoey Road: Baby Cried All Night - Powerful Owl Struck At Same Time Careel Bay During Owlet Fledgling Season

- Formal recovery strategies for every nationally threatened bird and species.
- National environmental standards to support more rigorous and consistent decision making.
- An independent national Environmental Protection Agency (to be called Environment Protection Australia) that would sit at arm’s length from the Government of the day and would be responsible for making decisions on project proposals that could harm threatened birds and important natural areas.
- The development of a more robust system for the management and use of environmental data by a statutory office, Environment Information Australia.
- Boosting people’s confidence in the new laws. To improve public trust in the new laws and the institutions that will be responsible for delivering them the Government should provide the public with an opportunity to review and have its say.
- The Minister of the day will retain a broad general ‘call in’ power that will allow them to make a decision on individual proposals that are deemed to warrant ministerial intervention. What is proposed in this new package is weaker than the settings under current laws.
- The new laws envisage a system of “restoration actions’ – offsets – and “restoration contributions” to compensate for “residual” environmental impacts. This mechanism will need to be carefully designed, implemented and monitored to ensure that it supports real improvements for wildlife and their habitat, and doesn’t facilitate destruction.
"It is noted that the off-set requirement could be met by total payment of $8,850,139.39 into the Biodiversity Conservation Fund in accordance with the NSW Biodiversity Offsets Scheme."
Transport for NSW (Transport) proposes to carry out road improvements along Wakehurst Parkway between Frenchs Forest Road, Frenchs Forest and Pittwater Road, North Narrabeen.These include intersection upgrades and focus on improving safety and capacity for this key road link in Sydney’s northern beaches.A Review of Environmental Factors (REF) including Biodiversity Development Assessment Report (BDAR) has been prepared for the proposal. These documents outline the proposed work, potential construction and environmental impacts and mitigation measures.The documents will be available for viewing on the project webpage from Monday 6 November.Formal submissions about the proposal are welcomed by emailing northplace@transport.nsw.gov.au by 5pm Wednesday 6 December.The Wakehurst Parkway project team will be at Oxford Falls Main Hall at Oxford Falls Peace Park on Thursday 16 November from 3pm to 6pm, and at Bilarong Community Hall on Saturday 18 November from 10am to 2pm.
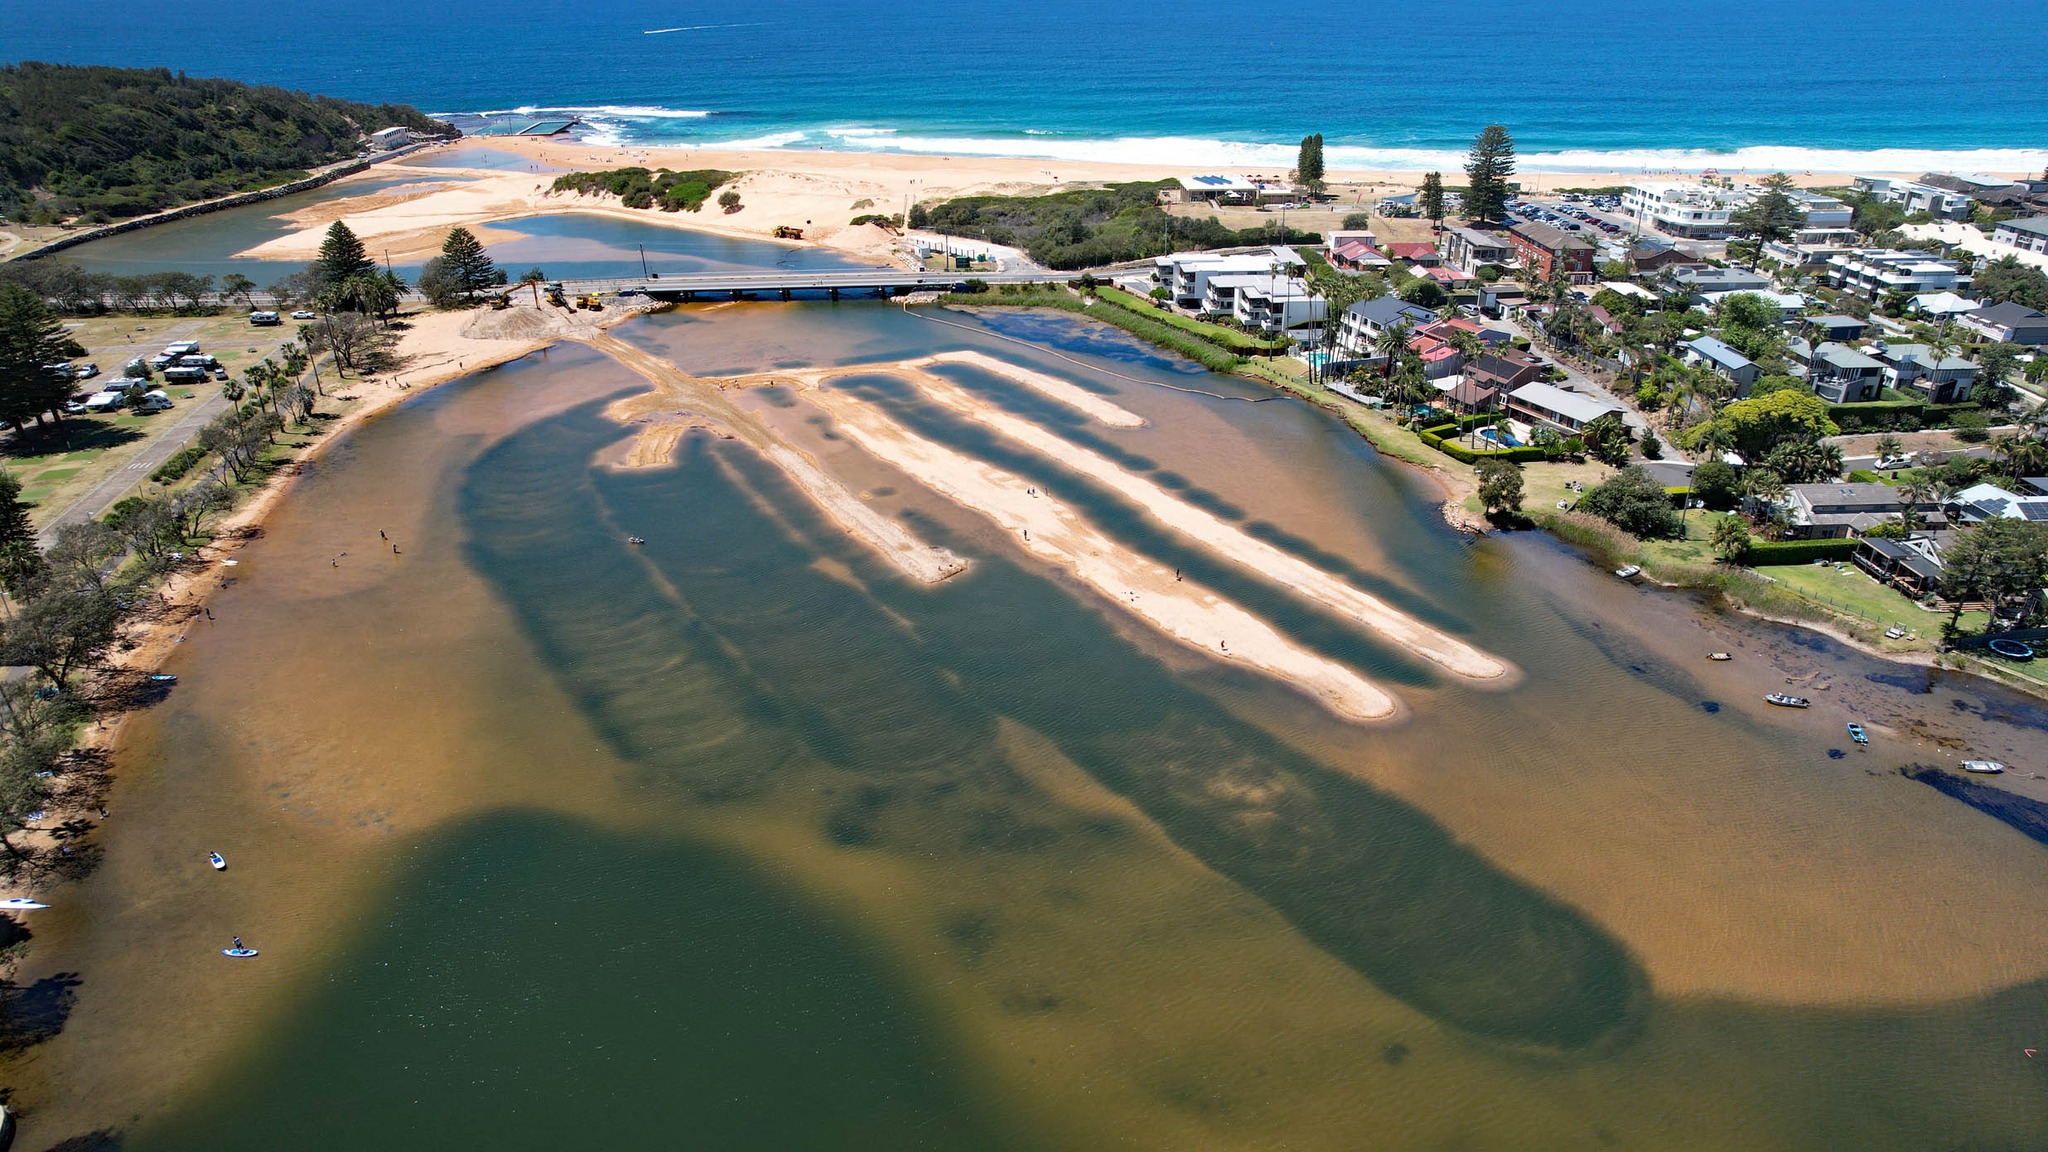
Narrabeen Lagoon Entrance Works 2023: Update Pics

Wakehurst Parkway Update: REF For Proposed Works Available From November 6
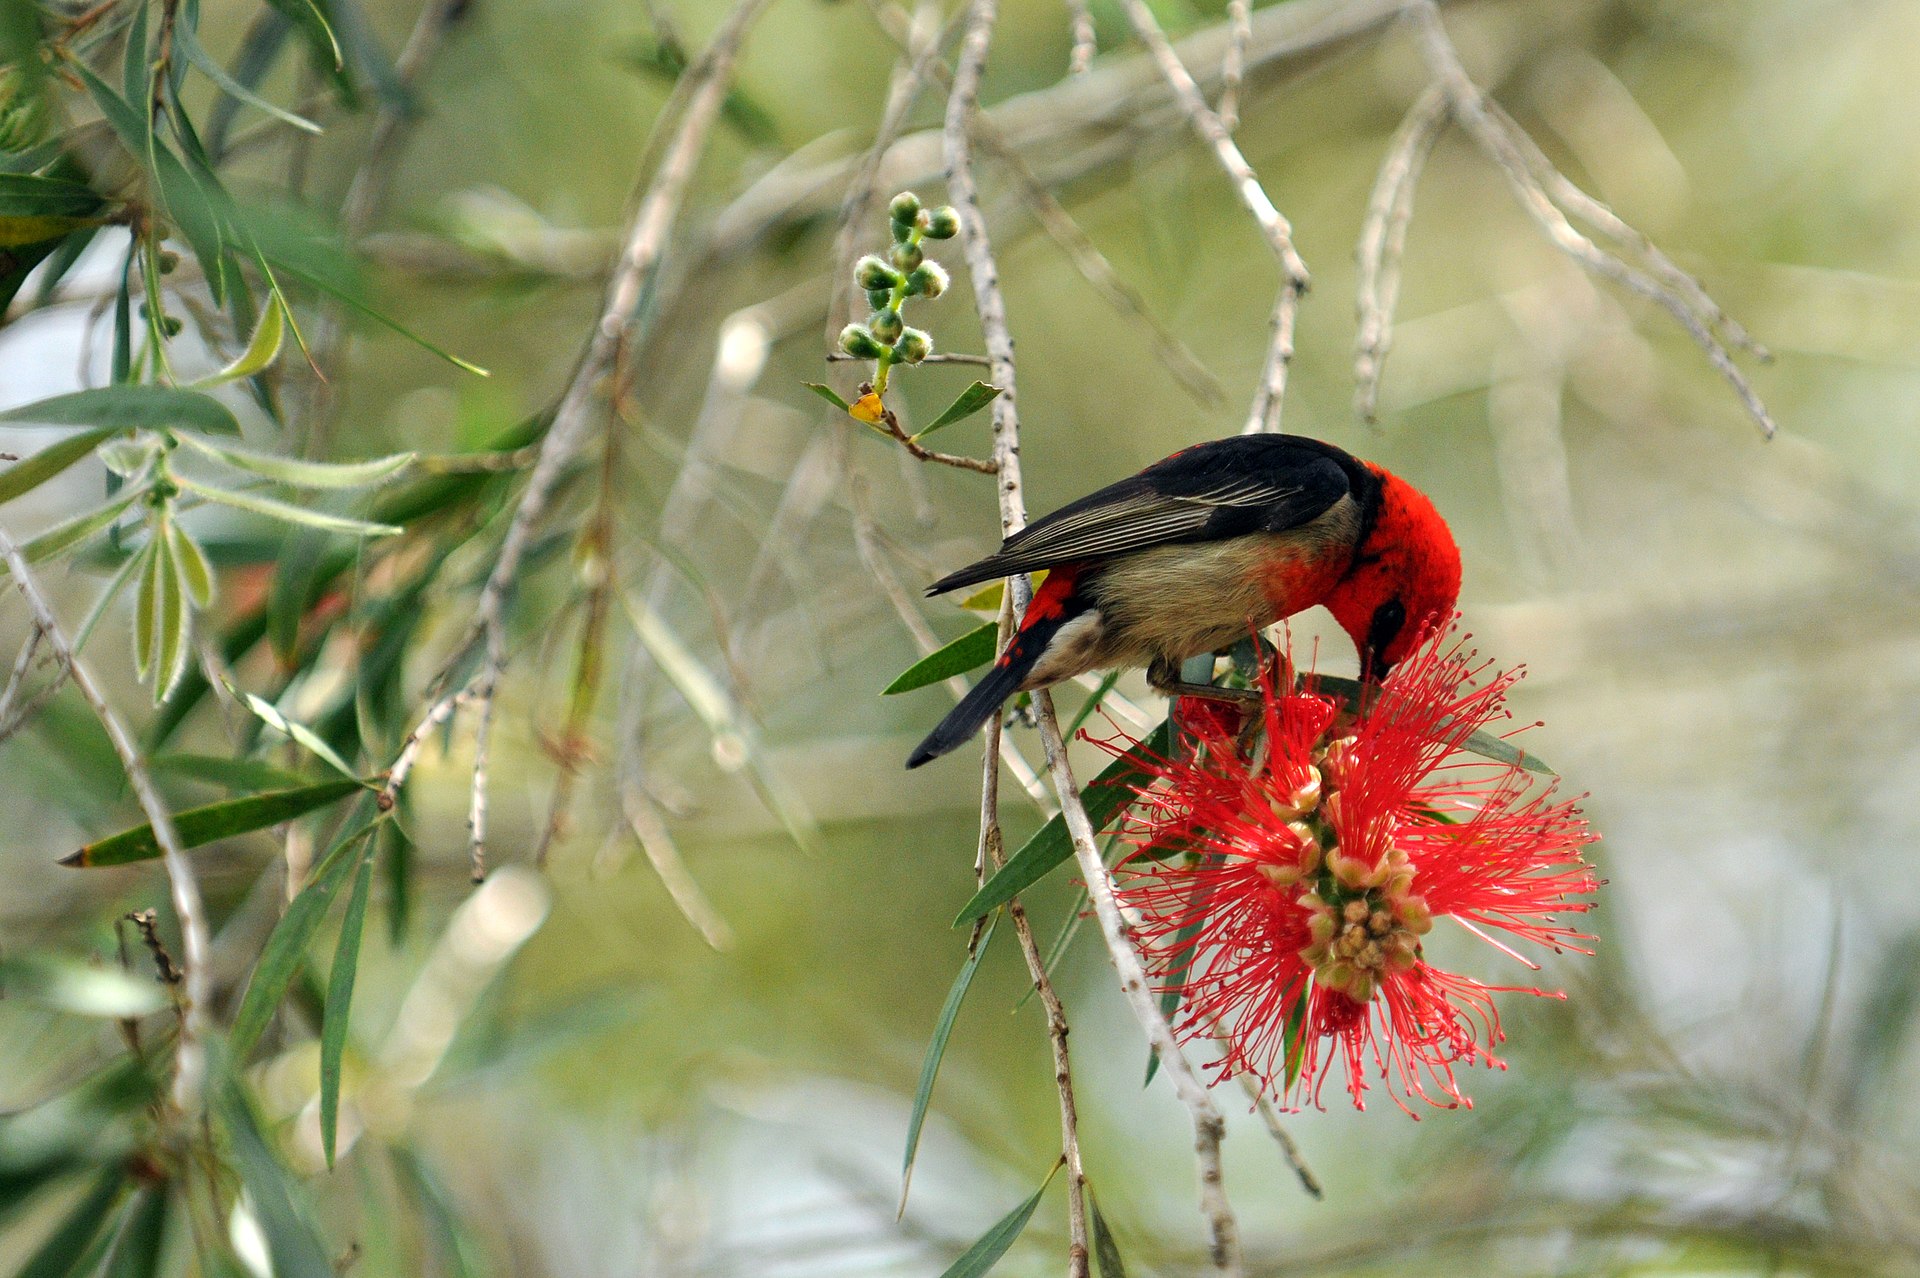
Scarlet Honeyeaters Spotted In Avalon Beach: Spring 2023
Sydney Local Native: Pittwater Edition Published
- average maximum height and width
- a description of the plant's form
- flower colour and flowering season
- an overview of the plant's best features
- its preferences for soil, water and light
- where it is naturally distributed.

A monster eddy current is spinning into existence off the coast of Sydney. Will it bring a new marine heatwave?

Right now, there’s something big spinning off the coast from Sydney – a giant rotating vortex of sea water, powerful enough to dominate the ocean currents off south-eastern Australia.
Oceanographers describe these spinning water bodies as “eddies” – but they’re not the small eddy currents you see in creeks or rivers. Ocean eddies are enormous. They’re usually hundreds of kilometres across (100–300km), up to 2km deep and can be visible from space.
It turns out these eddies drive change underwater by spawning marine heatwaves. Our new research demonstrates the link between a warm ocean eddy and a record-breaking marine heatwave which struck off Sydney from December 2021 to February 2022.
Now it’s happening again. An even bigger eddy is forming about 50km off Sydney. We have just returned from a 24-day research voyage on CSIRO’s research vessel RV Investigator to explore this monster eddy.
Our estimates suggest this 400km wide beast holds 30% more heat than normal for this part of the ocean. Its currents are spinning at 8km per hour. And the temperatures deep underwater are up to 3°C above normal. If it moves close to shore, it could trigger another coastal marine heatwave.
How Can An Eddy Current Make A Heatwave?
Eddies are the ocean equivalent of storms in the atmosphere. Like weather patterns, they can be warm or cold. But ocean eddies can shape the ocean’s patterns of life.
Warm eddies are like ocean deserts with little life, while cold eddies are typically much more productive. That’s because they draw up nutrients like nitrogen and phosphorous from the deep sea, which become food for plankton.
Just as storms can in the atmosphere, ocean eddies can drive extreme “ocean weather”. That’s because warm eddies can bring in masses of warm water and keep it there for months. Sea life is often very finely attuned to temperature, so a sudden heatwave like this can heavily impact ecosystems.
It’s important to better understand how eddy currents grow, move and decay better. That’s because they can store large amounts of heat and can temporarily increase coastal sea levels.
What we do know is that warm eddies along Australia’s east coast can be fed by the East Australian Current when it becomes unstable. The current wobbles back and forth until eventually the wobbles form a coherent circle – an eddy – or adding to an existing one. It’s like a garden hose thrashing around on the grass when the flow is too great. These unstable currents can be small, on the kilometre scale, or huge.

Our research pinpointed the root cause of the 2021 marine heatwave off Sydney. A large warm eddy formed. But it couldn’t spiral away into deeper waters, because there were cold eddies to the north and south preventing it. That’s very similar to what can happen in the atmosphere, where a high pressure system can be held in place by other weather systems.
Now, it looks as if history is repeating.
Over the past month, an enormous eddy – fully 400km wide and 3km deep – has been spinning up just off southeastern Australia. It’s being fed by the warm East Australian Current, which brings warm water from the tropics down to more temperate waters. This eddy is bigger and warmer than most eddies in the region, especially at this time of year. It has been growing over the past month, and is pushing up against cold waters to the south. Where the two systems meet there are very strong temperature differences – up to 5°C over just 4km.
You can get some insight into how eddy currents behave from satellites.
Our trip on the research vessel RV Investigator made it possible for us to grasp how this powerful current was behaving – in three dimensions.
We also released drifters, GPS-tracked buoys which float around the eddy centre in a massive circle. Some have been carried more than 2,000km in the last month, passing where they originally started. Others have escaped the eddy and headed east into the Pacific.
These sensors and instruments have given us vital information. Now we know the water in the eddy is flowing at a fast walking pace, around 8km per hour. And we know that while the currents within the eddy are rotating quickly, the eddy itself has remained fairly stationary off the NSW coast, growing with warm waters from further north.
We also deployed five diving Argo floats. Satellite data shows us surface temperatures in the eddy have hit 23°C, two degrees above average for a month. But Argo floats show us the temperatures are even more extreme 500m below the surface, more than 3°C above average.
What happens to eddies? Like atmospheric systems, these are effectively heat engines. They transport heat to new areas as they whirl in the ocean. While they hold heat a long time, eventually it’s lost to the atmosphere and through mixing at the edges of the current. Eventually, they disappear.
But as we head into summer, the mega eddy is unlikely to go anywhere. If it moves towards the coast, where marine life is concentrated, we will see water temperatures spike – and possibly, underwater disaster for many species.
We would like to thank the RV Investigator’s Master, Captain Andrew Roebuck, Deck Officers and crew and the CSIRO technical staff.![]()
Moninya Roughan, Professor in Oceanography, UNSW Sydney; Amandine Schaeffer, Senior lecturer, UNSW Sydney; Junde Li, Postdoctoral research associate, and Shane Keating, Associate Professor, UNSW Sydney
This article is republished from The Conversation under a Creative Commons license. Read the original article.
NSW Government's Update On The Creation Of The Great Koala National Park
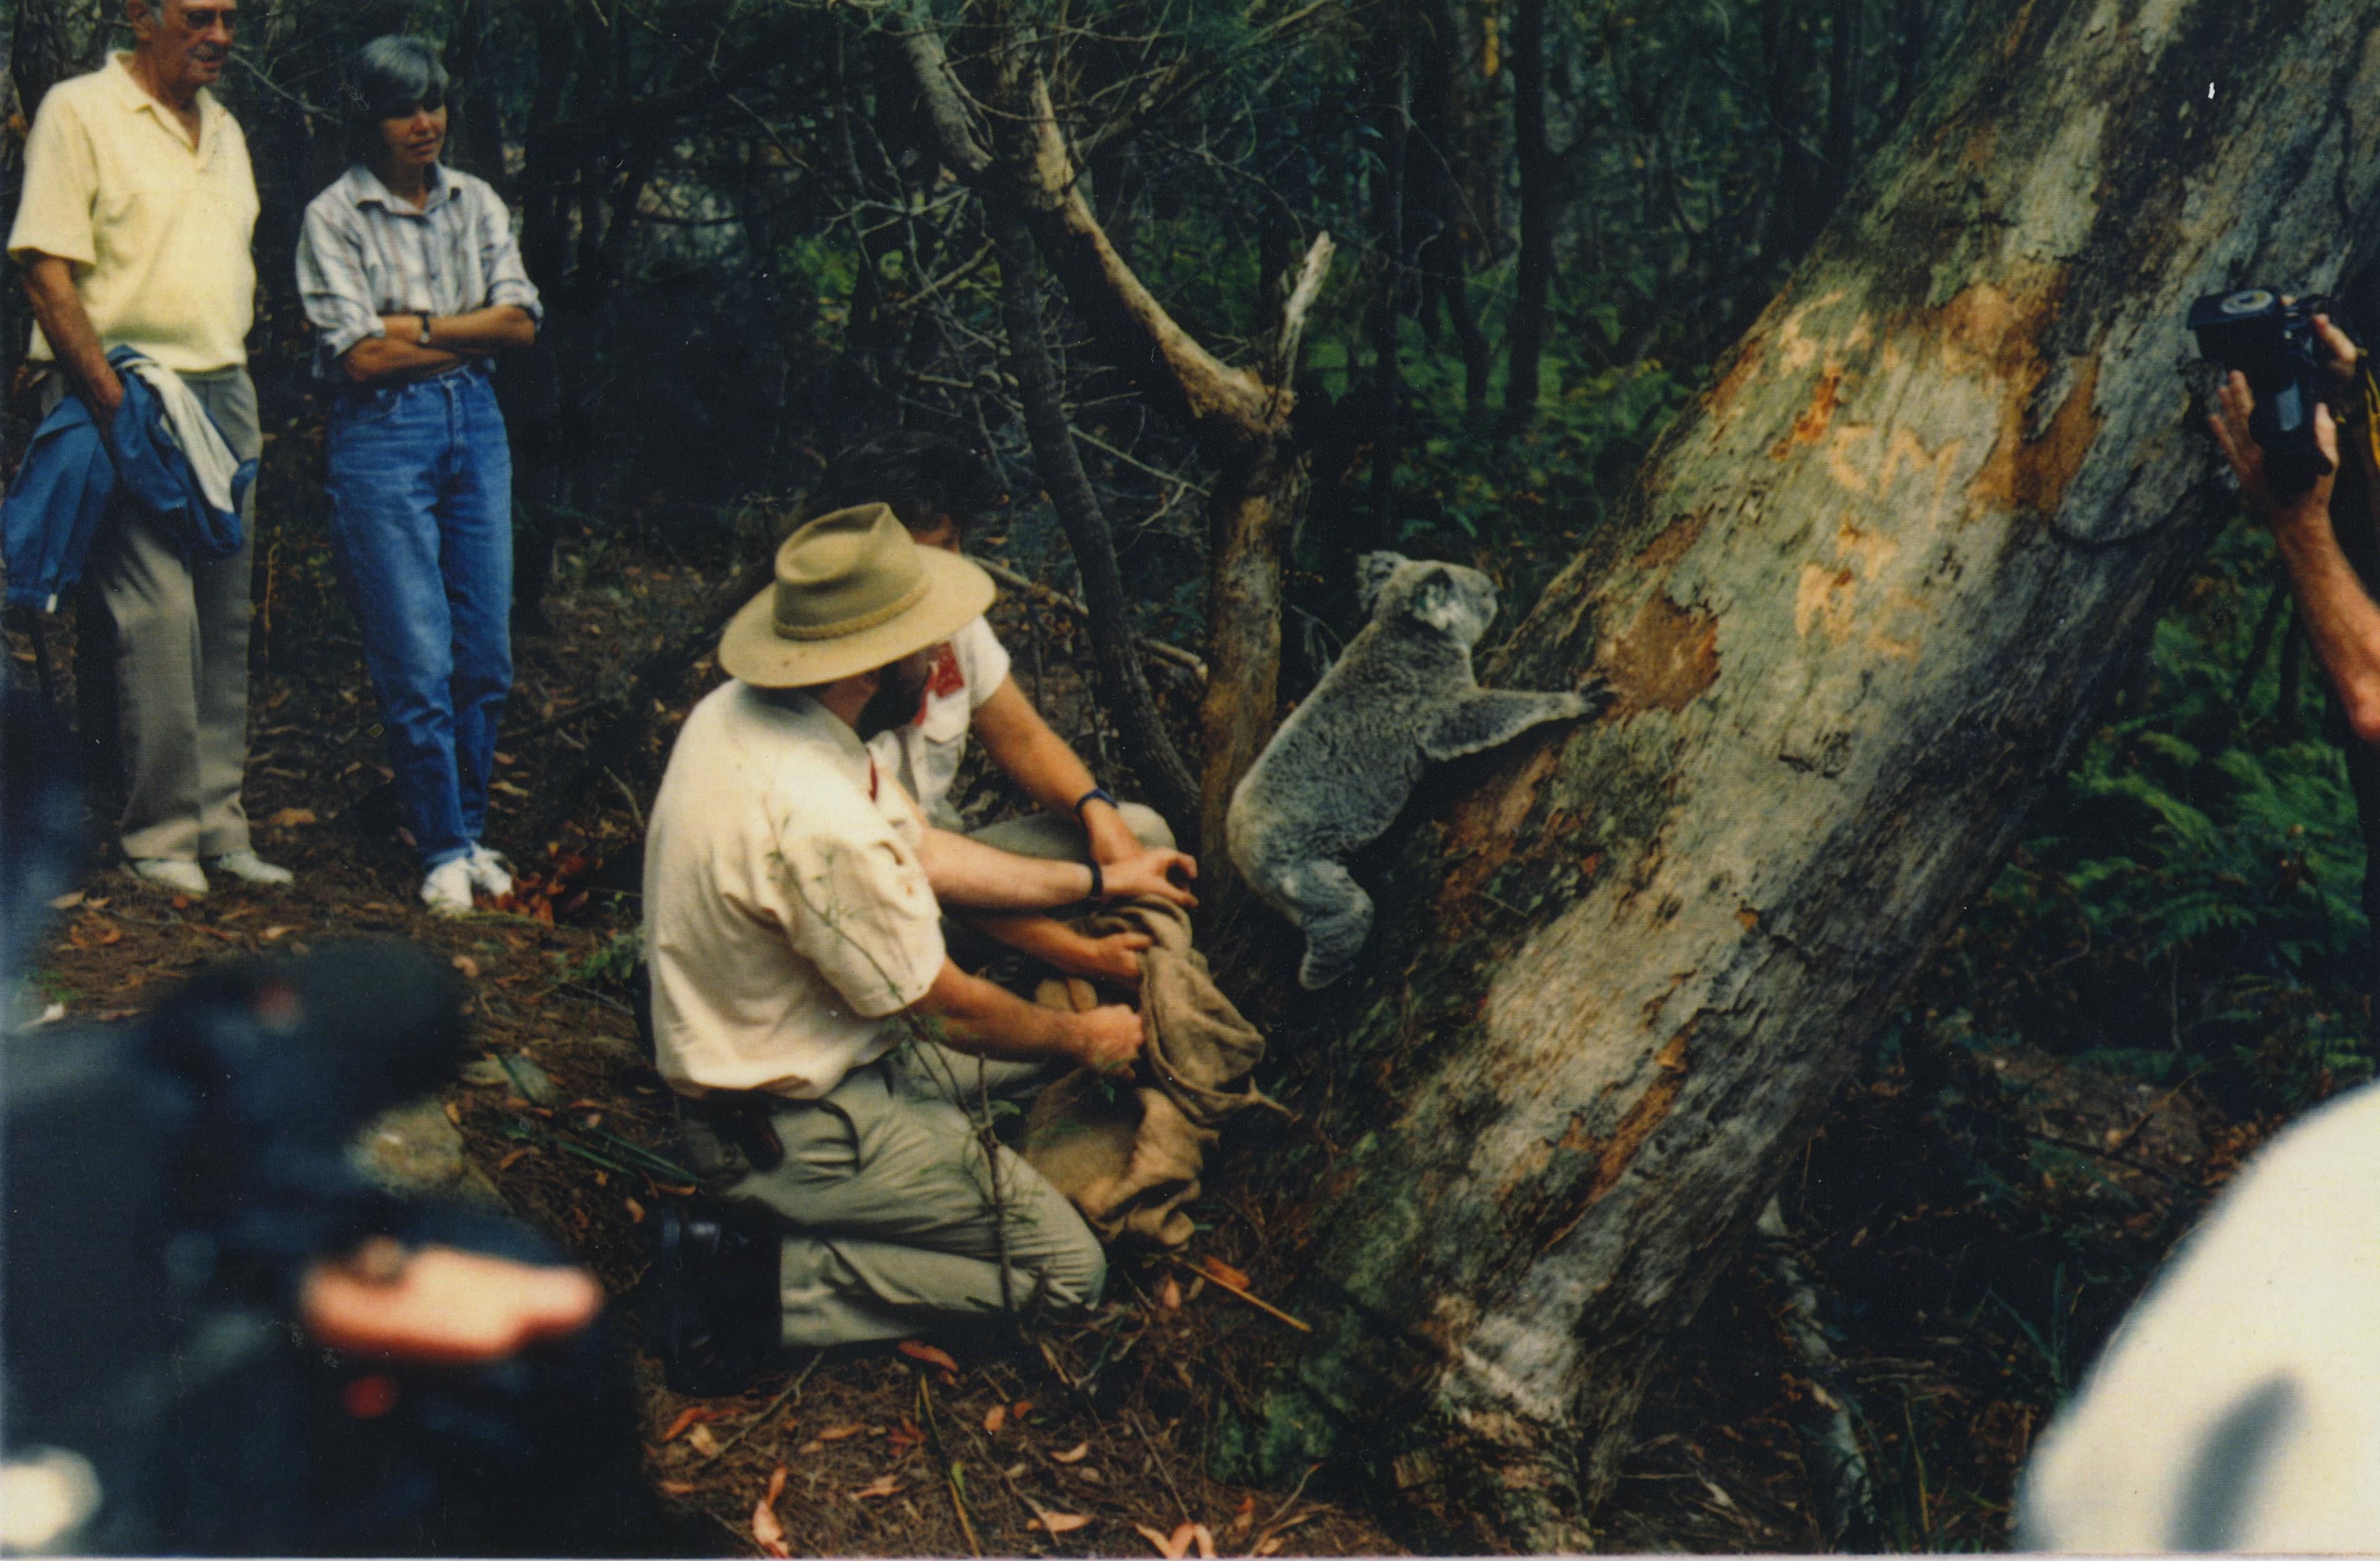
The release of an 8 years old female back into Angophora Reserve after she had been bombarded by magpies. Taronga Zoo picked her up and nursed her back to health before the release on November 5th, 1989. Doug Bladen and Marita Macrae are in the background representing the Avalon Preservation Trust (now APA). Photo by Geoff Searl OAM
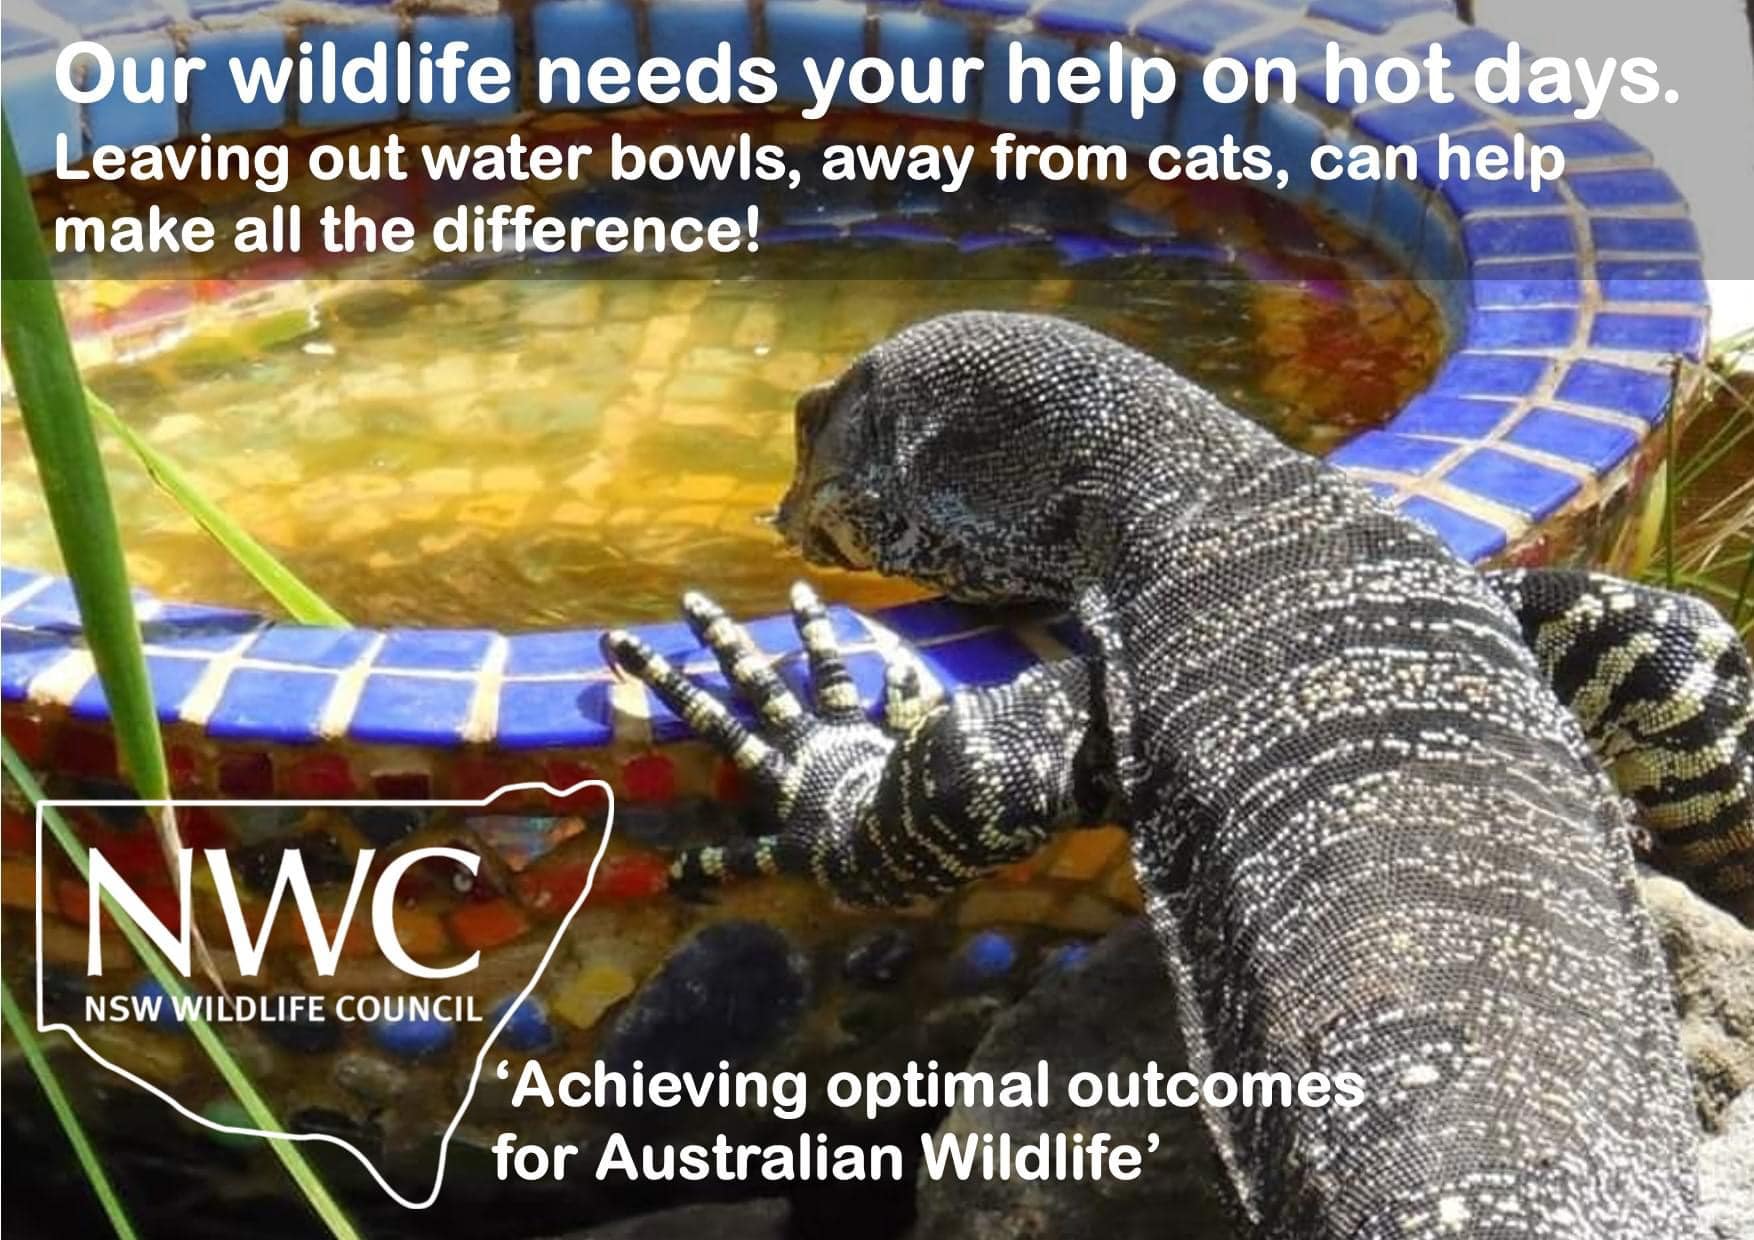
Please Look Out For Wildlife During Heatwave Events

AER Releases Social Licence For Electricity Transmission Directions Paper
- What expectations should be held of transmission businesses in undertaking community engagement
- What outcomes need to be achieved from engagement
- When and how social licence issues can be factored into regulatory tests for the approval of and recovery of cost for new transmission development
- What evidence is needed to justify transmission network expansion and associated expenditure.
- clearly identify the information that is the subject of the confidentiality claim
- provide a non-confidential version of the submission in a form suitable for publication.
Bushwalk Fundraiser
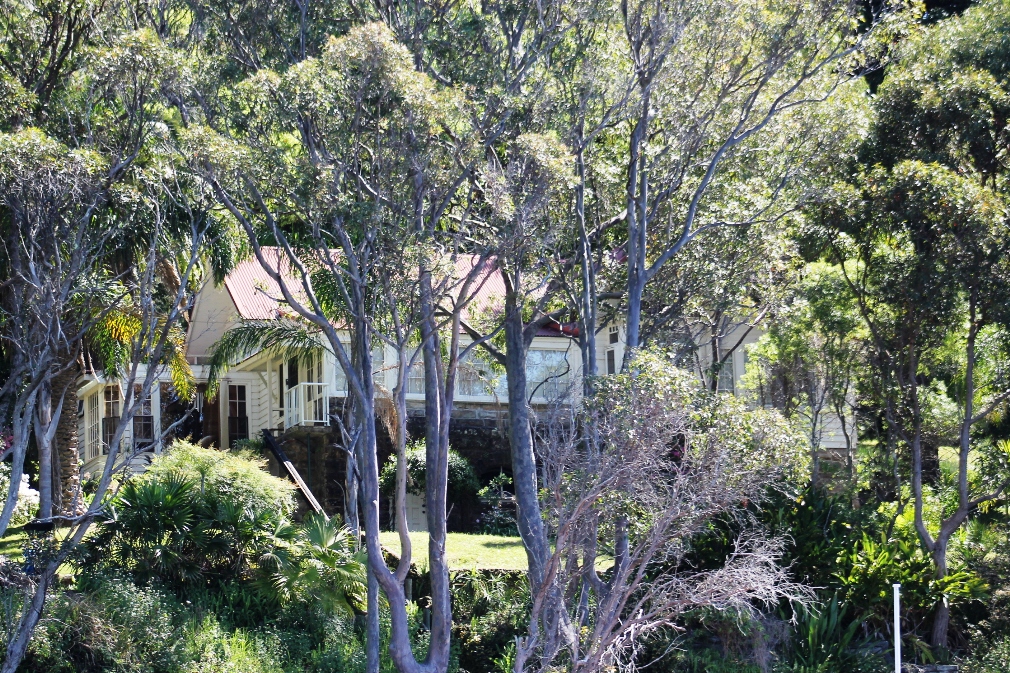
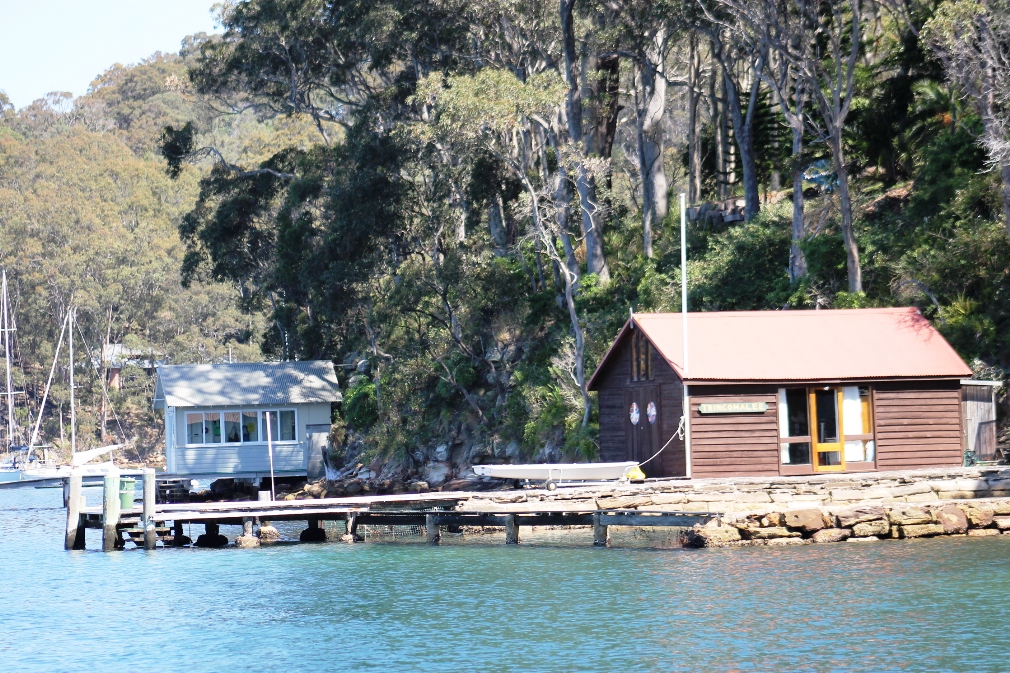
- Friday 10 November
- Friday 8 December
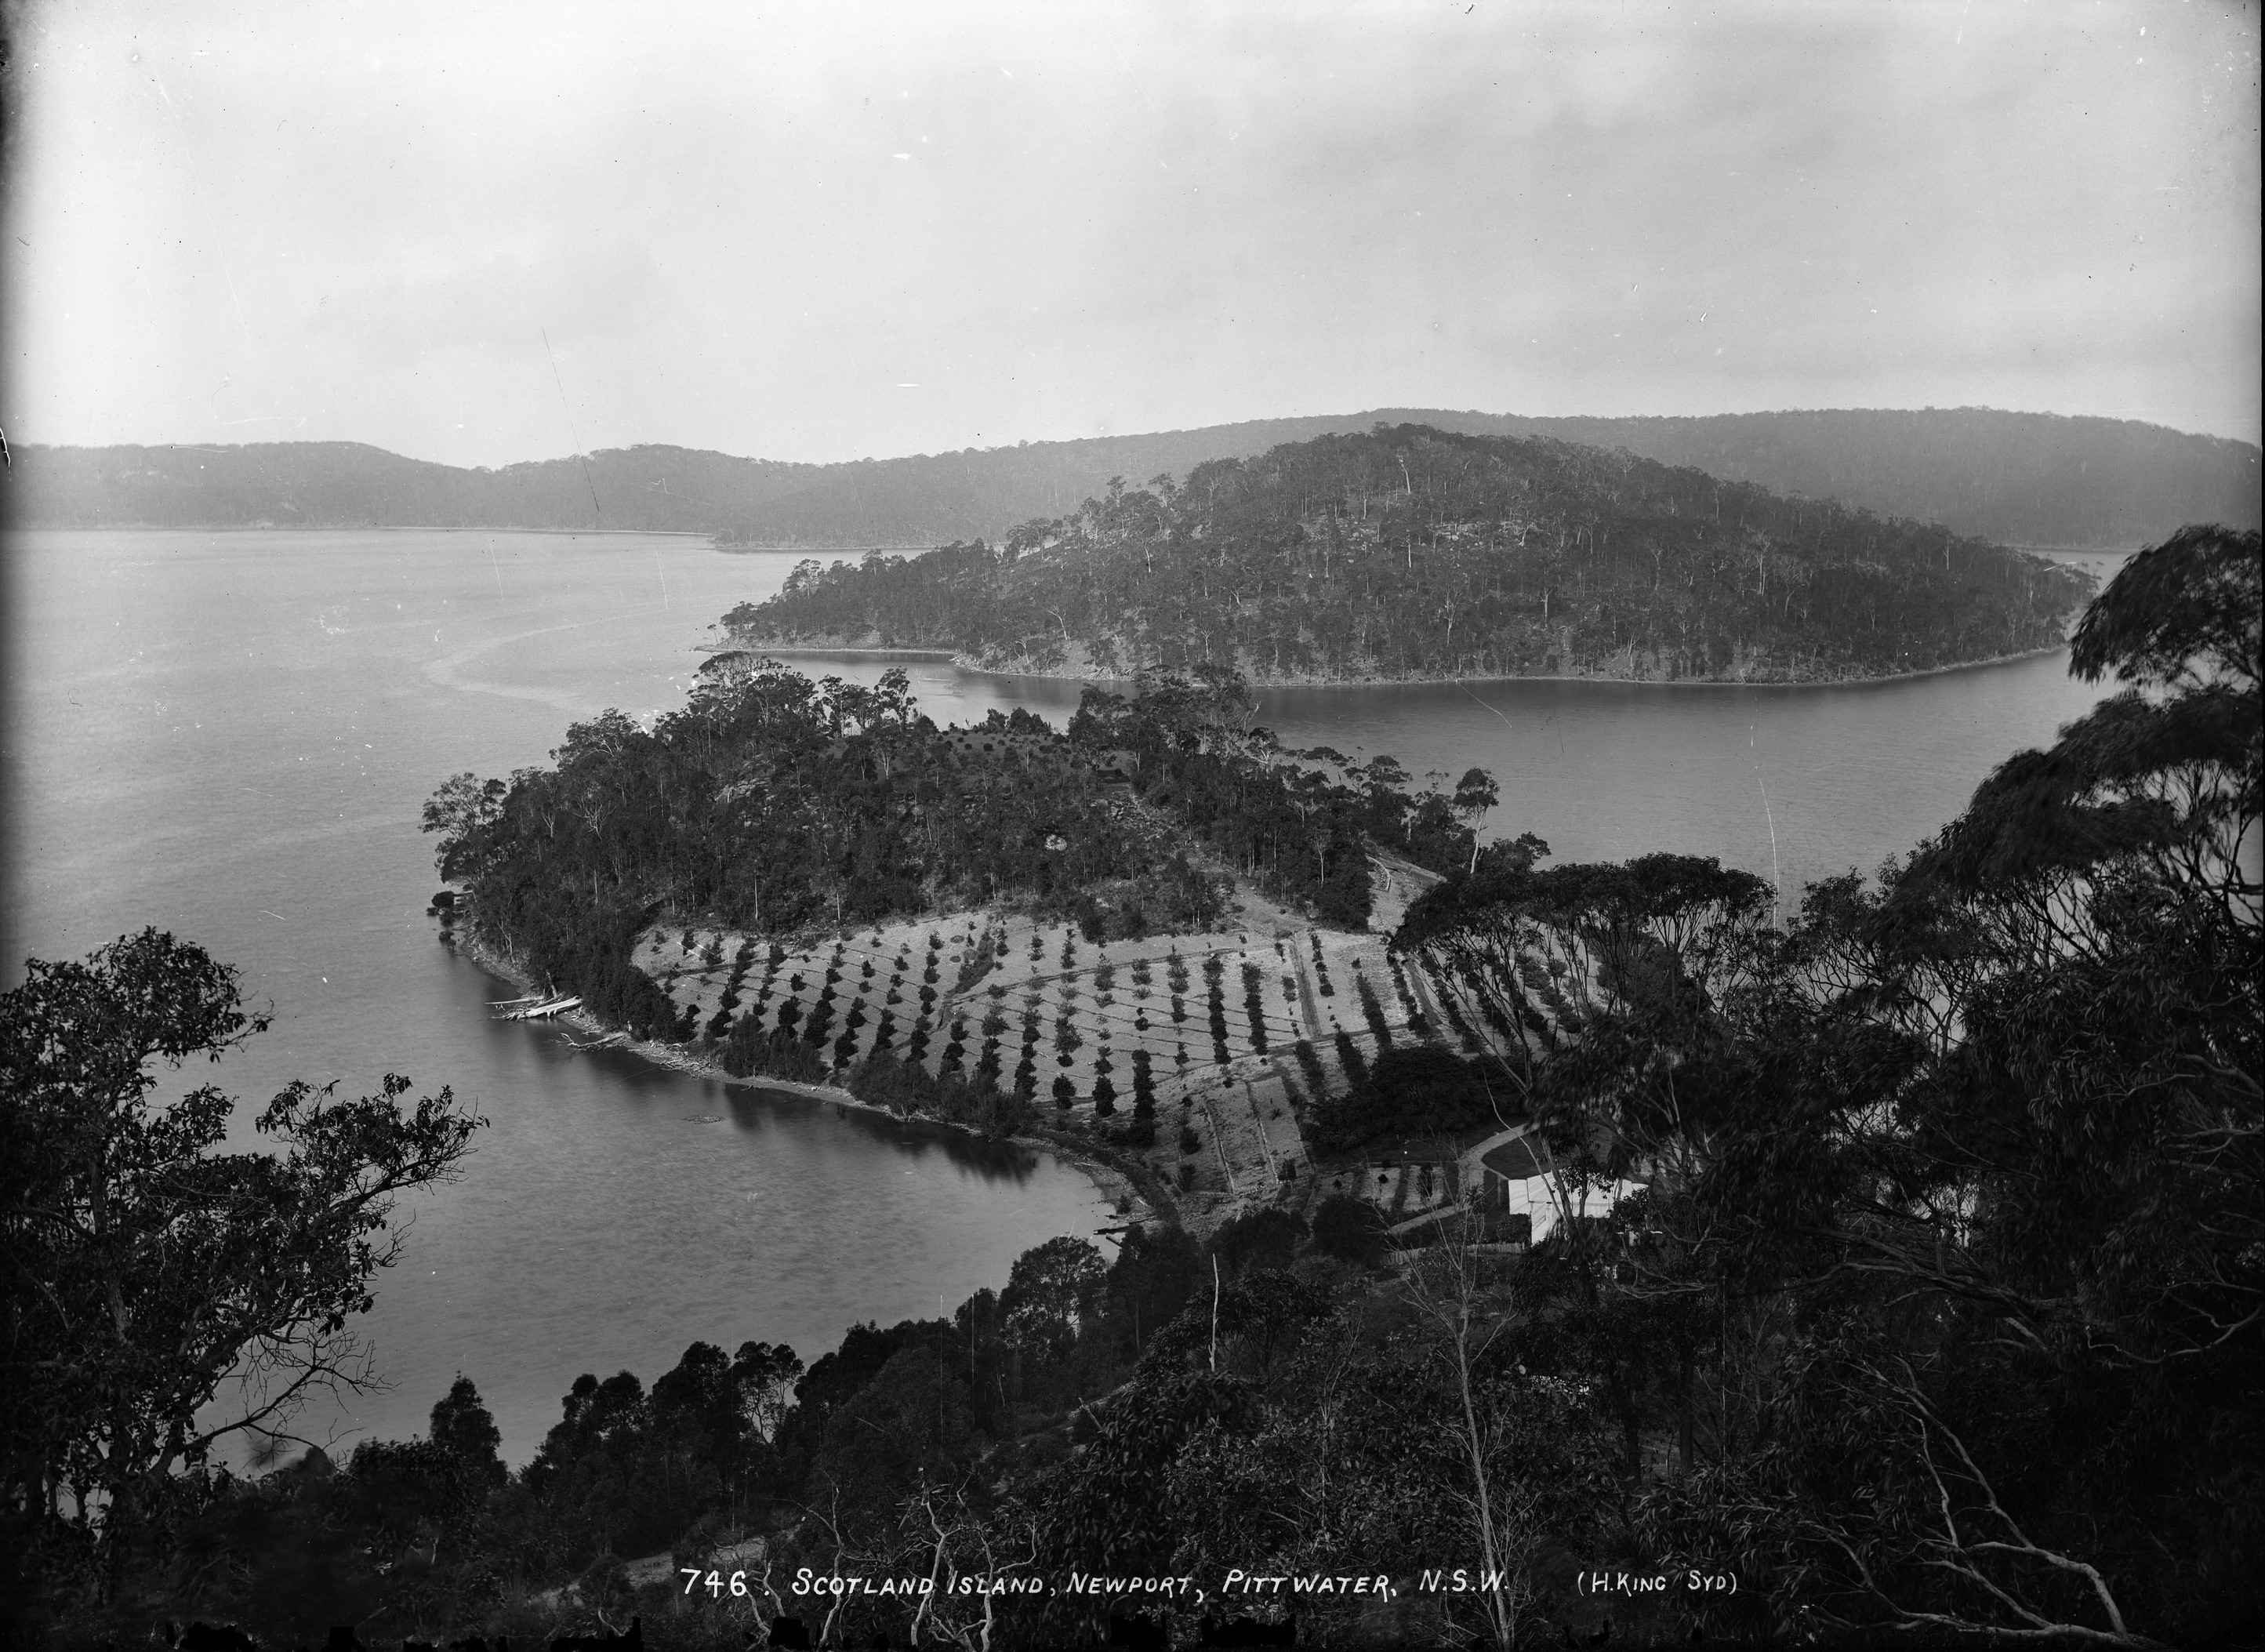
'Scotland Island, Newport, Pittwater, N.S.W.', photo by Henry King, Sydney, Australia, c. 1880-1886. and section from to show cottage on neck of peninsula at western end with no chimneys through roof. From Tyrell Collection, courtesy Powerhouse Museum
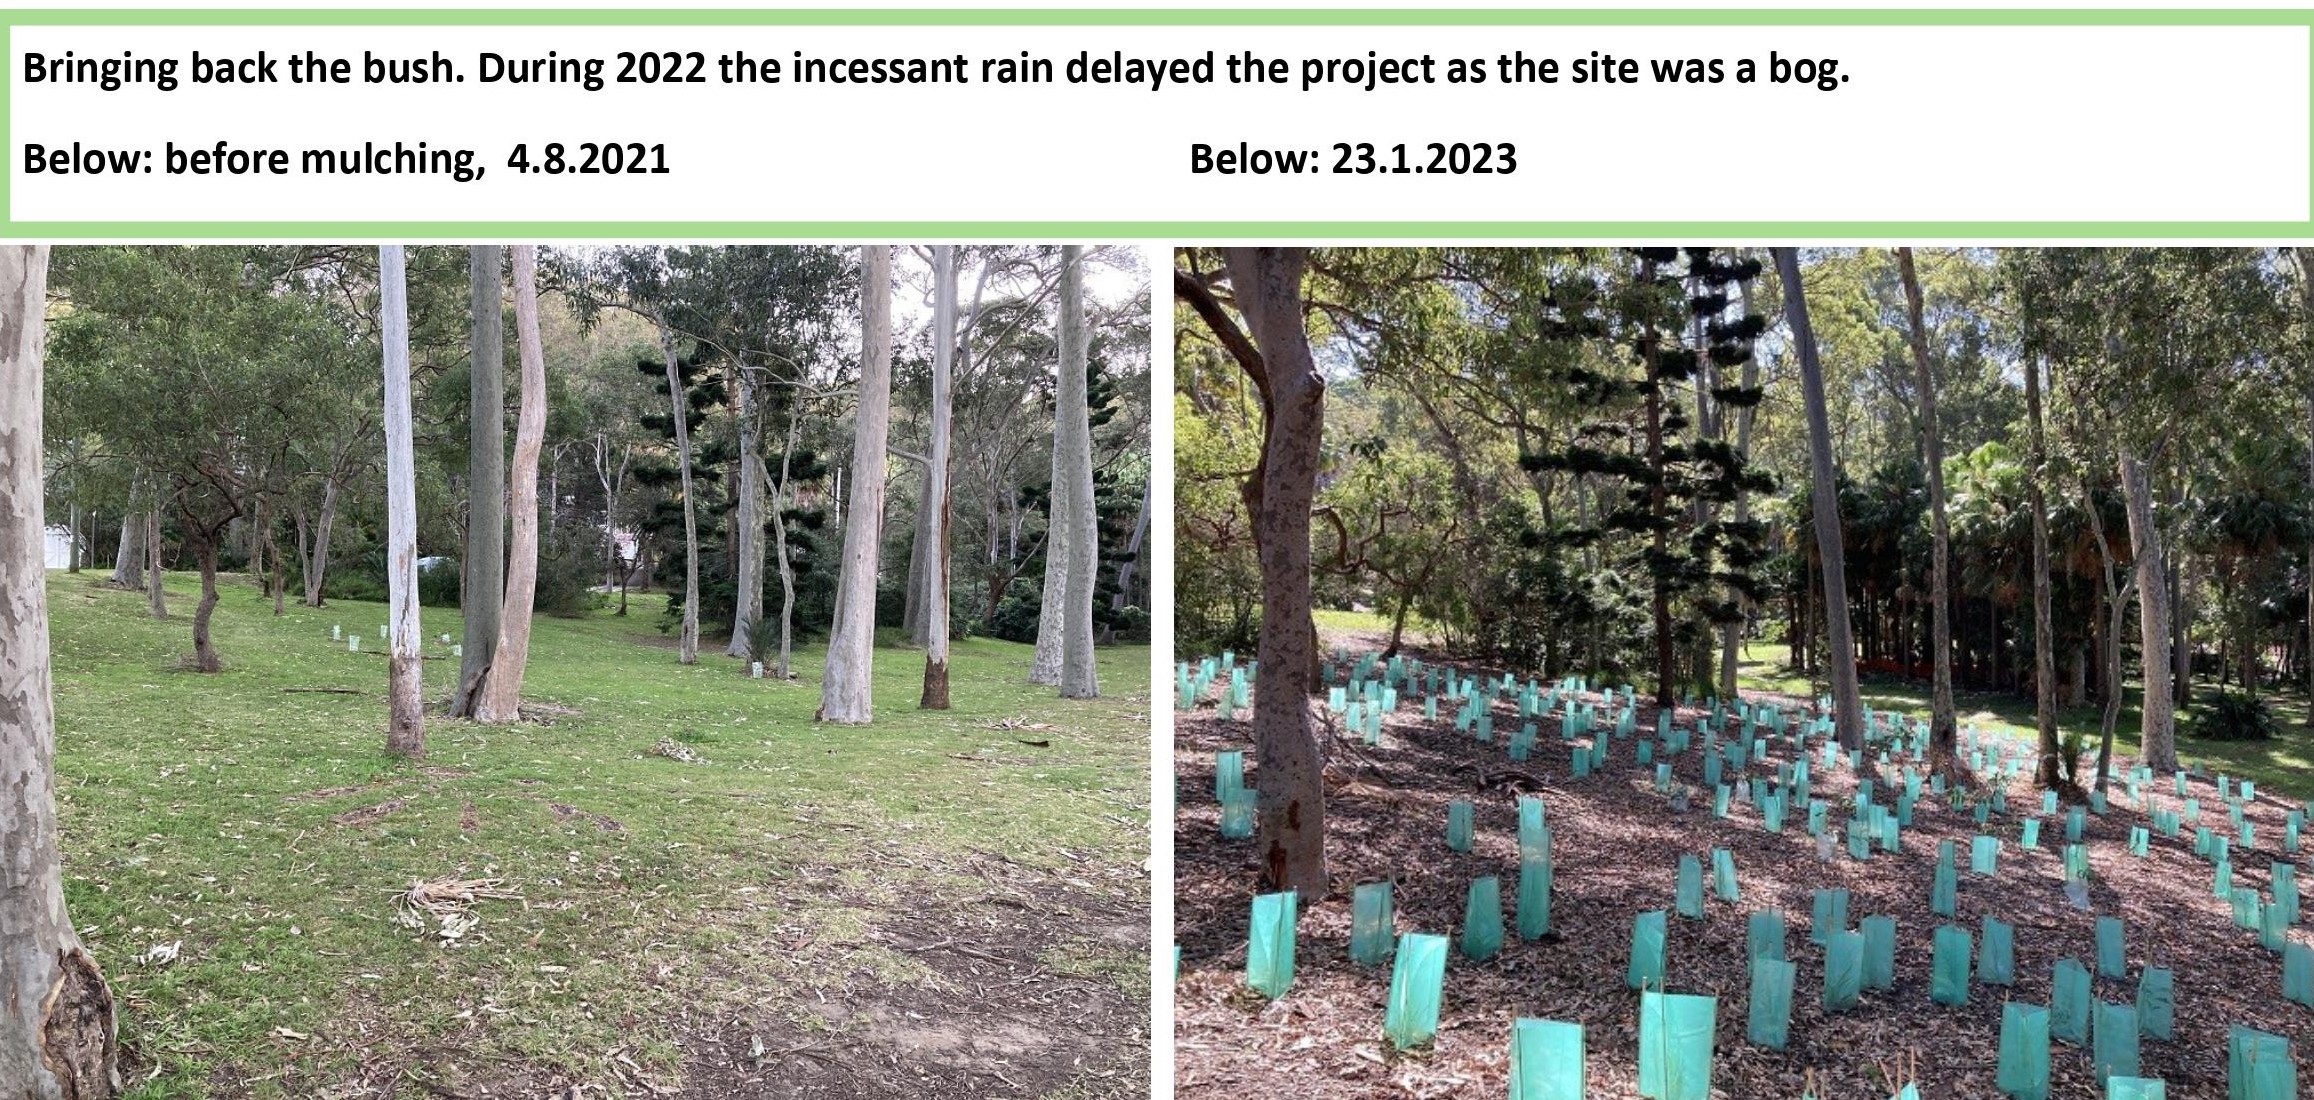
Palmgrove Park Avalon: New Bushcare Group Begins
 Palmgrove Park Avalon is a remnant of the Spotted Gum forest that was once widespread on the lower slopes of the Pittwater peninsula. This bushland’s official name and forest type is Pittwater and Wagstaffe Endangered Ecological Community, endangered because so much has been cleared for suburban development. Canopy trees, smaller trees and shrubs, and ground layer plants make up this community. Though scattered remnant Spotted Gums remain on private land, there is little chance of seedlings surviving in gardens and lawns. More information HERE
PNHA Guided Nature Walks 2023
Our walks are gentle strolls, enjoying and learning about the bush rather than aiming for destinations. Wear enclosed shoes. We welcome interested children over about 8 years old with carers. All Welcome.
So we know you’re coming please book by emailing: pnhainfo@gmail.com and include your phone number so we can contact you if weather is doubtful.
The whole PNHA 2023 Guided Nature Walks Program is available at: http://pnha.org.au/test-walks-and-talks/

Red-browed finch (Neochmia temporalis). Photo: J J Harrison
Report Fox Sightings
%20(1).jpg?timestamp=1675893929686)
Marine Wildlife Rescue Group On The Central Coast
A new wildlife group was launched on the Central Coast on Saturday, December 10, 2022.
Marine Wildlife Rescue Central Coast (MWRCC) had its official launch at The Entrance Boat Shed at 10am.
The group comprises current and former members of ASTR, ORRCA, Sea Shepherd, Greenpeace, WIRES and Wildlife ARC, as well as vets, academics, and people from all walks of life.
Well known marine wildlife advocate and activist Cathy Gilmore is spearheading the organisation.
“We believe that it is time the Central Coast looked after its own marine wildlife, and not be under the control or directed by groups that aren’t based locally,” Gilmore said.
“We have the local knowledge and are set up to respond and help injured animals more quickly.
“This also means that donations and money fundraised will go directly into helping our local marine creatures, and not get tied up elsewhere in the state.”
The organisation plans to have rehabilitation facilities and rescue kits placed in strategic locations around the region.
MWRCC will also be in touch with Indigenous groups to learn the traditional importance of the local marine environment and its inhabitants.
“We want to work with these groups and share knowledge between us,” Gilmore said.
“This is an opportunity to help save and protect our local marine wildlife, so if you have passion and commitment, then you are more than welcome to join us.”
Marine Wildlife Rescue Central Coast has a Facebook page where you may contact members. Visit: https://www.facebook.com/profile.php?id=100076317431064
- Ph: 0478 439 965
- Email: marinewildlifecc@gmail.com
- Instagram: marinewildliferescuecc

Watch Out - Shorebirds About
.JPG.opt1460x973o0,0s1460x973.jpg?timestamp=1663629195339)
Possums In Your Roof?: Do The Right Thing

Aviaries + Possum Release Sites Needed

Bushcare In Pittwater
Where we work Which day What time
Avalon
Angophora Reserve 3rd Sunday 8:30 - 11:30am
Avalon Dunes 1st Sunday 8:30 - 11:30am
Avalon Golf Course 2nd Wednesday 3 - 5:30pm
Careel Creek 4th Saturday 8:30 - 11:30am
Toongari Reserve 3rd Saturday 9 - 12noon (8 - 11am in summer)
Bangalley Headland 2nd Sunday 9 to 12noon
Bayview
Winnererremy Bay 4th Sunday 9 to 12noon
Bilgola
North Bilgola Beach 3rd Monday 9 - 12noon
Algona Reserve 1st Saturday 9 - 12noon
Plateau Park 1st Friday 8:30 - 11:30am
Church Point
Browns Bay Reserve 1st Tuesday 9 - 12noon
McCarrs Creek Reserve Contact Bushcare Officer To be confirmed
Clareville
Old Wharf Reserve 3rd Saturday 8 - 11am
Elanora
Kundibah Reserve 4th Sunday 8:30 - 11:30am
 Mona Vale
 Mona Vale Beach Basin 1st Saturday 8 - 11am
Mona Vale Dunes 2nd Saturday +3rd Thursday 8:30 - 11:30am
Newport
Bungan Beach 4th Sunday 9 - 12noon
Crescent Reserve 3rd Sunday 9 - 12noon
North Newport Beach 4th Saturday 8:30 - 11:30am
Porter Reserve 2nd Saturday 8 - 11am
North Narrabeen
Irrawong Reserve 2nd Saturday 2 - 5pm
Palm Beach
North Palm Beach Dunes 3rd Saturday 9 - 12noon
Scotland Island
Catherine Park 2nd Sunday 10 - 12:30pm
Elizabeth Park 1st Saturday 9 - 12noon
Pathilda Reserve 3rd Saturday 9 - 12noon
Warriewood
Warriewood Wetlands 1st Sunday 8:30 - 11:30am
Whale Beach
Norma Park 1st Friday 9 - 12noon
Western Foreshores
Coopers Point, Elvina Bay 2nd Sunday 10 - 1pm
Rocky Point, Elvina Bay 1st Monday 9 - 12noon
Friends Of Narrabeen Lagoon Catchment Activities

Gardens And Environment Groups And Organisations In Pittwater
The Beetaloo gas field is a climate bomb. How did CSIRO modelling make it look otherwise?

Even as Australia braces for a summer of projected extreme heatwaves and bushfires amid the intensifying climate crisis, the fossil gas industry is gearing up for a truly enormous new fracking project in the Northern Territory’s Beetaloo Basin.
In February, a CSIRO-backed report was published, stating Beetaloo could be developed without adding to Australia’s net emissions. In May, the Northern Territory government gave the green light to the project, citing the report as evidence emissions could be “mitigated, reduced or in some cases eliminated”.
This report is important. It was produced by CSIRO’s Gas Industry Social and Environmental Research Alliance in response to a key recommendation from the NT’s Pepper Inquiry into fracking. That recommendation? Territory and federal governments should “seek to ensure” no net increase in life-cycle greenhouse gas emissions in Australia from fracking in the NT.
How could it find a massive new fossil fuel field won’t add to emissions? Our forensic analysis of the report found it made the most optimistic assumptions about emissions at every stage, and placed far too much faith in Australia’s ability to offset emissions.
Remind Me – How Big Is Beetaloo?
Big. The fossil fuel basin 500 kilometres south of Darwin is bigger than any current gas project on Western Australia’s North-West Shelf.
We estimate 1.2 billion tonnes of greenhouse gas emissions would be emitted over 25 years to 2050 – a figure 45% higher than in the report.
Our analysis shows annual domestic emissions from fracking in the Beetaloo and processing at Darwin’s Middle Arm industrial precinct would produce up to 49 million tonnes of carbon dioxide equivalent, 11% of Australia’s total emissions in 2021. That means a single project would produce more emissions than the entire reduction goal under Labor’s revised safeguard mechanism.
Our deep dive into the CSIRO report found its cumulative domestic emissions projections are underestimates of up to 84% in some cases. Emissions are underestimated at almost every stage, from how emissions-intensive fracked gas is to how much methane is lost to the atmosphere and how much is emitted in manufacturing LNG. We have submitted our report to the Senate Inquiry into Middle Arm.
The report also underestimates upstream emissions – emissions created by actually fracking the gas and transporting it to Darwin – by up to 110%, and emissions from turning gas into LNG at the plant by up to 89%.
A CSIRO spokesperson told The Conversation:
CSIRO scientists have delivered a robust and detailed technical analysis, confirmed through an intensive peer review process, of the greenhouse gas emissions associated with onshore gas production scenarios in the Beetaloo Sub-basin, and important information about realistic mitigation and offset options. CSIRO stands behind the quality of its research and the integrity of its peer review process.
No Net Increase – By The Power Of Offsets?
Any large new fossil gas project would, of course, add more greenhouse gases to the atmosphere. So how could it represent “no net increase”?
The answer: offsets. The report recommends sequestering carbon in Australia’s soils and forests to offset the global warming caused by burning Beetaloo’s single product, gas.
As we and many other experts have demonstrated, offsets are riddled with flaws. Every tonne of fossil carbon we emit stays in the atmosphere far longer than the 100 years a land-based offset might store carbon. Around 40% of our emissions remain in the atmosphere after 100 years. Up to a quarter is still there after 1,000 years. And up to 20% is still there after 10,000 years.
Offsets often don’t work over the short term, because many are simply not real or not additional to what would otherwise have happened. Their problems are now well known, but not broadly accepted by Australian policymakers.
CSIRO’s report uses overly optimistic estimates of how many offsets are likely to be available. If they could be realised, the offsets required for Beetaloo would take up very large areas of land in Australia – up to 2.9 million hectares, 12 times the size of the Australian Capital Territory.
The Problem With Blue Hydrogen
Blue hydrogen is touted as another use for Beetaloo gas. Here, hydrogen is made from fossil gas, with emissions captured and stored to reduce the climate impact of Beetaloo.
CSIRO’s report assumes fossil gas facilities can capture 90% of the carbon from the project. This is way too optimistic. To date, no commercial blue hydrogen facility in the world has achieved anything close.
Even with carbon capture and storage research shows blue hydrogen is very carbon intensive. Energy experts project that green hydrogen – made by breaking water apart with clean energy – will undercut blue hydrogen on cost by around 2030.
What About The Middle Arm LNG Project?
After the gas is extracted by hydraulic fracturing, it would be transported to the Middle Arm precinct in Darwin to get ready for shipping. We analysed the total cumulative emissions, including exports. The result? 25 years of emissions from this project and its large LNG plant in Darwin would be more than three times the entire country’s emissions in 2021.
One of the companies looking to profit from Beetaloo, Tamboran Energy, has already announced plans to expand after 2030. If this gets up, it would add the equivalent of another 30–38 million cars (10–13% of Australia’s 2021 emissions). Given there are only 15 million cars in Australia, this would wipe out the benefit of making our entire light vehicle fleet electric by the mid 2030s.
The International Energy Agency has shown we have to slash demand for fossil fuels 25% by 2030 and 80% by 2050 to keep heating under 1.5°C and limit the worst effects of climate change.
If it is allowed to proceed, this single project could undo all of our efforts to cut emissions. Beetaloo and Middle Arm are a climate bomb. They will produce vast volumes of emissions which cannot be offset. The atmosphere doesn’t respond to clever accounting, overly optimistic projections and reliance on offsets – only on how many tonnes of emissions end up there.![]()
Bill Hare, Adjunct Professor, Murdoch University
This article is republished from The Conversation under a Creative Commons license. Read the original article.
Carbon budget for 1.5°C will run out in six years at current emissions levels – new research
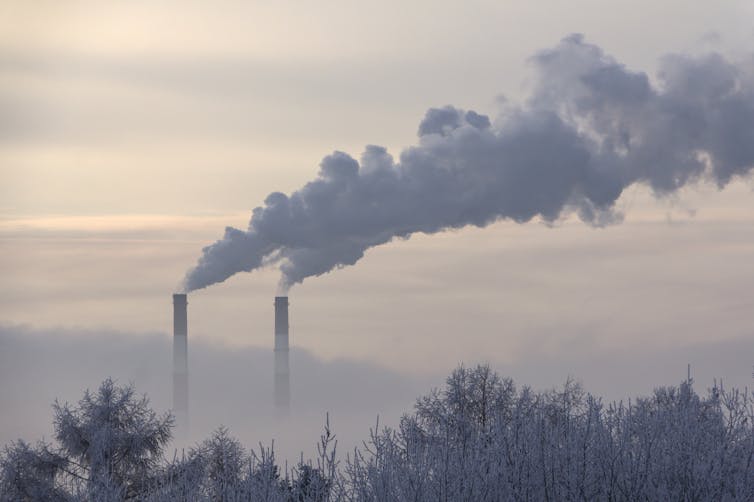
If humanity wants to have a 50-50 chance of limiting global warming to 1.5°C, we can only emit another 250 gigatonnes (billion metric tonnes) of CO₂. This effectively gives the world just six years to get to net zero, according to calculations in our new paper published in Nature Climate Change.
The global level of emissions is presently 40 gigatonnes of CO₂ per year. And, as this figure was calculated from the start of 2023, the time limit may be actually closer to five years.
Our estimate is consistent with an assessment published by 50 leading climate scientists in June and updates with new climate data many of the key figures reported by the Intergovernmental Panel on Climate Change (IPCC) in August 2021.
How much CO₂ can still be emitted while remaining under a certain level of warming is referred to as the “carbon budget”. The carbon budget concept works because the increase in Earth’s global mean surface temperature has increased in a linear fashion with the total amount of CO₂ people have emitted since the industrial revolution.
The other side of this equation is that, roughly speaking, warming stops when CO₂ emissions stop: in other words, at net zero CO₂. This explains why net zero is such an important concept and why so many countries, cities, and companies have adopted net zero targets.
We revised the remaining carbon budget down from the 500 gigatonnes reported by the the IPCC from the start of 2020. Some of this revision is merely timing: three years and 120 gigatonnes of CO₂ emissions later, the world is closer to the 1.5°C threshold. Improvements we made to the method for calculating budget adjustments shrank the remaining budget further.
Clearing The Air
Alongside CO₂, humanity emits other greenhouse gases and air pollutants that contribute to climate change. We adjusted the budget to account for the projected warming caused by these non-CO₂ pollutants. To do this, we used a large database of future emissions scenarios to determine how non-CO₂ warming is related to total warming.
Some of the warming caused by greenhouse gases is offset by cooling aerosols such as sulphates – air pollutants that are emitted along with CO₂ from car exhausts and furnaces. Almost all emissions scenarios project a reduction in aerosol emissions in the future, regardless of whether fossil fuels are phased out or CO₂ emissions continue unabated. Even in scenarios where CO₂ emissions increase, scientists expect stricter air quality legislation and cleaner combustion.

In its most recent report, the IPCC updated its best estimate of how much air pollution cools the climate. As a result, we expect that falling air pollution in future will contribute more to warming than previously assessed. This reduces the remaining 1.5°C budget by about another 110 gigatonnes.
Other updates we made to the carbon budget methodology tend to reduce the budget even more, such as projections of thawing permafrost that were not included in earlier estimates.
All Is Not Lost
It is important to stress that many aspects of our carbon budget estimate are uncertain. The balance of non-CO₂ pollutants in future emissions scenarios can be as influential on the remaining carbon budget as different interpretations of how the climate is likely to respond.
We also do not know for sure whether the planet will really stop warming at net zero CO₂ emissions. On average, evidence from climate models tends to suggest it will, but some models show substantial warming continuing for decades after net zero is reached. If further warming after net zero is the case, the budget would be further reduced.
These uncertain factors are why we quote a 50/50 likelihood of limiting warming to 1.5°C at 250 gigatonnes of CO₂. A more risk-averse assessment would report a two-in-three chance of staying under 1.5°C with a remaining budget of 60 gigatonnes - or one-and-a-half years of current emissions.
Time is running out to limit global heating to 1.5°C above pre-industrial levels. While we have revised the remaining carbon budget, the message from earlier assessments is unchanged: a dramatic reduction in greenhouse gas emissions is necessary to halt climate change.
It looks less likely that we will limit warming to 1.5°C, but this does not mean that we should give up hope. Our update also revised the budget for 2°C downwards relative to the IPCC’s 2021 estimate, but by a smaller amount – from 1,350 to 1,220 gigatonnes, or from 34 to 30 years of current emissions. If current national climate policies are fully implemented (admittedly, an optimistic scenario), this may be enough to hold warming below 2°C.
The risks of triggering tipping points such as the dieback of the Amazon rainforest increase – sometimes sharply – with increasing warming, but 1.5°C itself is not a hard boundary beyond which climate chaos abounds.
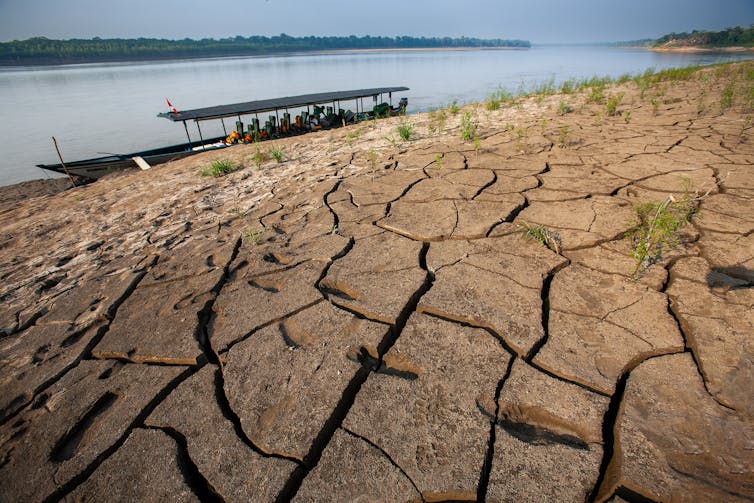
With effective action on emissions, we can still limit peak warming to 1.6°C or 1.7°C, with a view to bringing temperatures back below 1.5°C in the longer term.
This is a goal absolutely worth pursuing.

Don’t have time to read about climate change as much as you’d like?
Get a weekly roundup in your inbox instead. Every Wednesday, The Conversation’s environment editor writes Imagine, a short email that goes a little deeper into just one climate issue. Join the 20,000+ readers who’ve subscribed so far.![]()
Chris Smith, Senior Research Fellow in Climate Science, University of Leeds and Robin Lamboll, Research Fellow in Atmospheric Science, Imperial College London
This article is republished from The Conversation under a Creative Commons license. Read the original article.
Queensland’s fires are not easing at night. That’s a bad sign for the summer ahead
Calum Cunningham, University of Tasmania; David Bowman, University of Tasmania, and Grant Williamson, University of TasmaniaThis week, dozens of fires have burned across Queensland. More homes have burned in the state than during the 2019–2020 Black Summer – 57 so far this year, compared to 49.
The question many are asking is – are these fires normal? Our analysis shows these fires are weird in at least two ways.
First, many more than usual are burning through the night. This is anomalous, as nighttime usually brings lower temperatures and more moisture in the air, slowing or quelling fires. Queensland’s south-east and Western Downs regions are seeing more than five times more nighttime hotspots than average. And second, these fires are early in the season – especially the nighttime fires.
Why? Much of the east coast is now exceptionally dry. The plant regrowth from La Niña rains has dried out and is, in many places, set to burn. It’s still spring, with a long summer ahead. Where there has been rain, such as in eastern Victoria, it has sometimes coincided with intense bushfire. That gave rise to the extremely unusual situation in early October where residents grappled with fire one day and flood the next.
Put together, it suggests we may be facing a very bad fire season on the east coast and Tasmania. This is, of course, happening against the drumbeat of global warming, and the extra spike in heating this year caused by El Niño.
What’s Happening In Queensland?
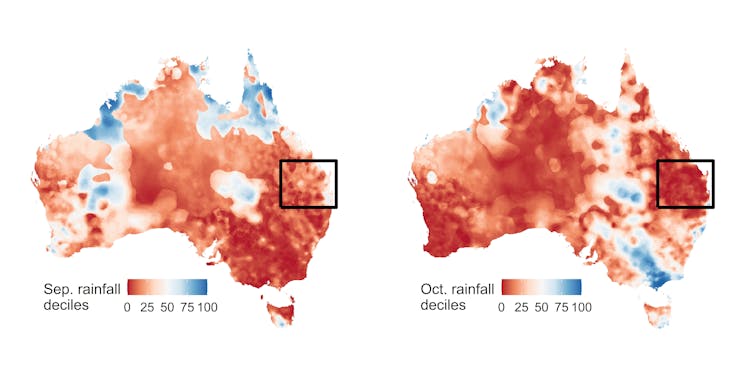
This spring has been exceptionally dry across most of the Sunshine State. September and October rainfall in the state’s heavily populated south has been close to the lowest on record and certainly in the bottom 10% of years.
This, in turn, has made many areas ready to burn. While there are fires up and down Queensland, most house losses have been within a few hundred kilometres of Brisbane. The town of Tara and surrounding areas has been worst affected.
How do we know where the fires are? Four times a day, heat-sensing satellites pass over Australia and pinpoint hotspots, where temperatures suddenly jump compared to areas nearby, based on square kilometre tiles. These tell us where the fires are, almost in real time and let us track them as they grow.
To this region, October has brought the third highest number of daytime hotspots seen this century. But it’s the nighttime hotspots that are freakish. Five times more nighttime hotspots than average have been detected compared to previous Octobers.
Why is that so concerning? Think of it from the firefighters’ point of view. If you know that fires usually ease off at night, you can plan around this reprieve – or even get some rest. But this belief will have to change as the nighttime barrier to fire weakens around the world.
Climate change can speed up how fast droughts happen, in what’s been dubbed “flash drought”. It was not so long ago that Australia’s east coast was seemingly underwater, with record-breaking floods. Now drought is back with a vengeance.
Is south-east Queensland seeing more fire than usual? On the whole, yes. And it’s early – one of the earliest seasons since satellite records began in 2001.
So far, most of the serious fires in this area are burning not through grasslands, as is happening in Central Australia, but through open forest and woodlands.
Could we see rainforests in Queensland burn, as we did during the Black Summer? It’s possible, but less likely. But we could see some areas which burned during Black Summer along the east coast burn again, though probably not to the same severity.
There’s certainly enough fuel for some areas on the east coast burned by the 2019–20 bushfires to re-burn, such as New South Wales’ coast and the fringes of the Blue Mountains. That would have serious ecological consequences for areas still in recovery if fires returned before seedlings matured.
Fire Scientists Are Flying Blind
For decades, we’ve known that parts of Australia – the world’s most fire prone continent – would be likely to see more intense and more damaging fires as climate change adds heat and takes away moisture in many regions.
One problem is that we and other professional fire scientists are forced to read the tea leaves from media reports to gauge what’s happening on the ground.
Data on fire progression, fuels and weather are often walled away in government agencies. Firefighters have access, but they are – rightly – focused on the immediate crisis at hand. And insurers have their own data sets on trends in property loss but they are commercially sensitive.
Because there’s no systematic and accessible way to publicise fire data, we end up with a lot of speculation in the media about whether this is a normal or abnormal fire season.
This could be easily fixed with more investment and coordination. Data from geostationary satellites have revolutionised fire spotting, shifting from six-hourly updates to every ten minutes.
These data and historic data, could and should be made easily available to non-specialists, ideally through either the Bureau of Meteorology or a new agency.
Researchers have a role to play in developing tools to help put this flood of data to use.
If we have better public data sets, we can also more quickly shut down talking points from climate deniers, who might claim “there’s nothing new – Queensland has always burned” or use selective statistics to claim the number of dangerous forest fires on Earth is declining. We can’t adapt as a society if we’re arguing whether the fires really are happening or really are this bad.
If we don’t start to adapt to new fire regimes – and fast – we will face a very real crisis. We could soon see insurers stop offering insurance, as some have in California. ![]()
Calum Cunningham, Postdoctoral Research Fellow, University of Tasmania; David Bowman, Professor of Pyrogeography and Fire Science, University of Tasmania, and Grant Williamson, Research Fellow in Environmental Science, University of Tasmania
This article is republished from The Conversation under a Creative Commons license. Read the original article.
Extreme weather is landing more Australians in hospital – and heat is the biggest culprit

Hospital admissions for injuries directly attributable to extreme weather events – such as heatwaves, bushfires and storms – have increased in Australia over the past decade.
A new report from the Australian Institute of Health and Welfare (AIHW) shows 9,119 Australians were hospitalised for injuries from extreme weather from 2012-22 and 677 people died from these injuries in the decade up to 2021.
In 2021-22, there were 754 injury hospitalisations directly related to extreme weather, compared to 576 in 2011-12.
Extreme heat is responsible for most weather-related injuries. Exposure to prolonged natural heat can result in physical conditions ranging from mild heat stroke, to organ damage and death.
As Australia heads into summer with an El Niño, it’s important to understand and prepare for the health risks associated with extreme weather.
A Spike Every Three Years
Extreme weather-related hospitalisations have spiked at more than 1,000 cases every three years, with the spikes becoming progressively higher. There were:
- 1,027 injury hospitalisations in 2013–14
- 1,033 in 2016–17
- 1,108 in 2019–20.
In each of these three years, extreme heat had the biggest impact on hospital admissions and deaths.
Extreme heat accounted for 7,104 injury hospitalisations (78% of all injury hospitalisations) and 293 deaths (43% of all injury deaths) in the ten year period analysed.
In 2011-12, there were 354 injury hospitalisations directly related to extreme heat. This rose to 579 by 2021-22.
El Niño And La Niña
Over the past three decades, extreme weather events have increased in frequency and severity.
In Australia, El Niño drives a period of reduced rainfall, warmer temperatures and increased bushfire danger.
La Niña, on the other hand, is associated with above average rainfall, cooler daytime temperatures and increased chance of tropical cyclones and flood events.
Although similar numbers of heatwave-related hospitalisations occurred in El Niño and La Niña years studied, the number of injuries related to bushfires was higher in El Niño years.
During the 2019–20 bushfires, in the week beginning January 5 2020, there were 1,100 more hospitalisations than the previous five-year average, an 11% increase.
Although El Niño hasn’t directly been proved as the cause for these three spikes, according to the Bureau of Meteorology, two of the three years (2016-17 and 2019-20) were El Niño summers. And the other year (2013-14) was the warmest neutral year on record at that time.
Regional Differences
Exposure to excessive natural heat was the most common cause leading to injury hospitalisation for all the mainland states and territories. From 2019 to 2022, there were 2,143 hospital admissions related to extreme heat, including:
- 717 patients from Queensland
- 410 from Victoria
- 348 from NSW
- 267 from South Australia
- 266 from Western Australia
- 73 from the Northern Territory
- 23 from the ACT
- 19 from Tasmania.

The report also includes state and territory data on hospitalisations related to extreme cold and storms.
During the ten-year period analysed, there were 773 injury hospitalisations and 242 deaths related to extreme cold. Extreme rain or storms accounted for 348 injury hospitalisations and 77 deaths.
From 2019 to 2022, there were 191 hospitalisations related to extreme cold, with Victoria recording the highest number (51, compared to 40 in next-placed NSW). During the same period there were 111 hospitalisations related to rain and storms, with 52 occurring in NSW and 28 in Queensland.
What About For Bushfires?
Over the ten-year period studied, there were 894 hospitalisations and 65 deaths related to bushfires.
Bushfire-related injury hospitalisations and deaths peaked in 2019–20, an El Niño year with 174 hospitalisations and 35 deaths. The two most common injuries that result from bushfires are smoke inhalation and burns.
During the 2019–20 bushfires, in the week beginning 5 January 2020 there were 1,100 more respiratory hospitalisations than the previous five-year average, an 11% increase.
The greatest increase in the hospitalisation rate for burns was 30% in the week beginning December 15 2019 — 0.8 per 100,000 persons (about 210 hospitalisations), compared with the previous 5-year average of 0.6 per 100,000 (an average of 155 hospitalisations).
Some People Are Particularly Vulnerable
Anyone can be affected by extreme weather-related injuries but some population groups are more at risk than others. This includes older people, children, people with disabilities, those with pre-existing or chronic health conditions, outdoor workers, and those with greater socioeconomic disadvantage.
People in these groups may have reduced capacity to avoid or reduce the health impacts of extreme weather conditions, for example older people taking medication may be less able to regulate their body temperature. “Thermal inequity” includes people living in poor quality housing who have difficulty accessing adequate heating and cooling.
For heat-related injuries between 2019–20 and 2021–22, people aged 65 and over were the most commonly admitted to hospital, followed by people aged 25–44.
Across age groups, men had higher numbers of heat related injury hospitalisations than women. This difference was most notable among those aged 25-44 and 45-64 years, where over twice as many men were hospitalised due to extreme heat as women.
We Still Don’t Have A Full Picture
The AIHW data only includes injuries which were serious enough for patients to be admitted to hospital; it doesn’t include cases where patients treated in an emergency department and sent home without being admitted.
It includes injuries that were directly attributable to weather-related events but does not include injuries that were indirectly related. For example, it doesn’t include injuries from road traffic accidents that occur due to wet weather, since the primary cause of injury would be recorded as “transport”.
Improved surveillance of weather-related injuries could help the health system and the community better prepare for responding to extreme weather conditions. For example, better data aids communities in predicting what resources will be needed during periods of extreme weather.
A more complete picture of injuries during weather events could also be used to inform people of actions they can take to protect their own health. Given a predicted hot summer, this could be a matter of life or death.
This article was co-authored by Sarah Ahmed and Heather Swanston from the Injuries and System Surveillance Unit at the Australian Institute of Health and Welfare.![]()
Amy Peden, NHMRC Research Fellow, School of Population Health & co-founder UNSW Beach Safety Research Group, UNSW Sydney
This article is republished from The Conversation under a Creative Commons license. Read the original article.
We discovered three new species of marsupial. Unfortunately, they’re already extinct

Australia is famous for its diverse and unique marsupials, and infamous for its world-leading rate of mammal extinctions.
In our latest research, we have added new names to the list of Australian marsupials – and at the same time, new entries to the grim catalogue of species driven to extinction since European colonisation.
Our new study, published in Alcheringa, has identified three previously unknown species of small carnivores called mulgaras, which live in the dry country of Australia’s west and north.
The species were “hiding” in museums, among specimens collected since the 19th century, and none of them survive today.
A Deeper Look At Mulgaras
Mulgaras (Dasycercus) are small, ferocious carnivorous marsupials that are so well adapted to their arid habitats that they do not need to drink water. They play important roles in maintaining the health of their environments by controlling populations of insects and small rodents, and turning over desert soils through foraging.
Until recently, it was thought there were only two species of mulgara, the brush-tailed mulgara (D. blythi) and the crest-tailed mulgara (D. cristicauda).
Earlier efforts to classify mulgaras focused on external differences, such as the hair on their tail or the number of nipples. Our new work looked deeper, through an analysis of skulls and teeth.
Mammals use their teeth for many things, most obviously as offensive or defensive weapons, for eating, and for manipulating the environment. If the shape of a species’ teeth changes in some way, this could indicate an adaptation to a change in diet or environment. With enough adaptions and changes, a new species emerges.
In our investigation, we examined “subfossils” – skeletal remains that are not old enough to be true fossils – from sites around Australia where mulgaras are no longer found.
We trawled through animal trapping and subfossil collections made since the 19th century in museums across every mainland state and territory in Australia, and even the Natural History Museum of London. Subfossil specimens from the Nullarbor Plain, the Great Victoria Desert, and the northern Swan Coastal Plain were of particular interest as they had not been attributed to a particular species until now.
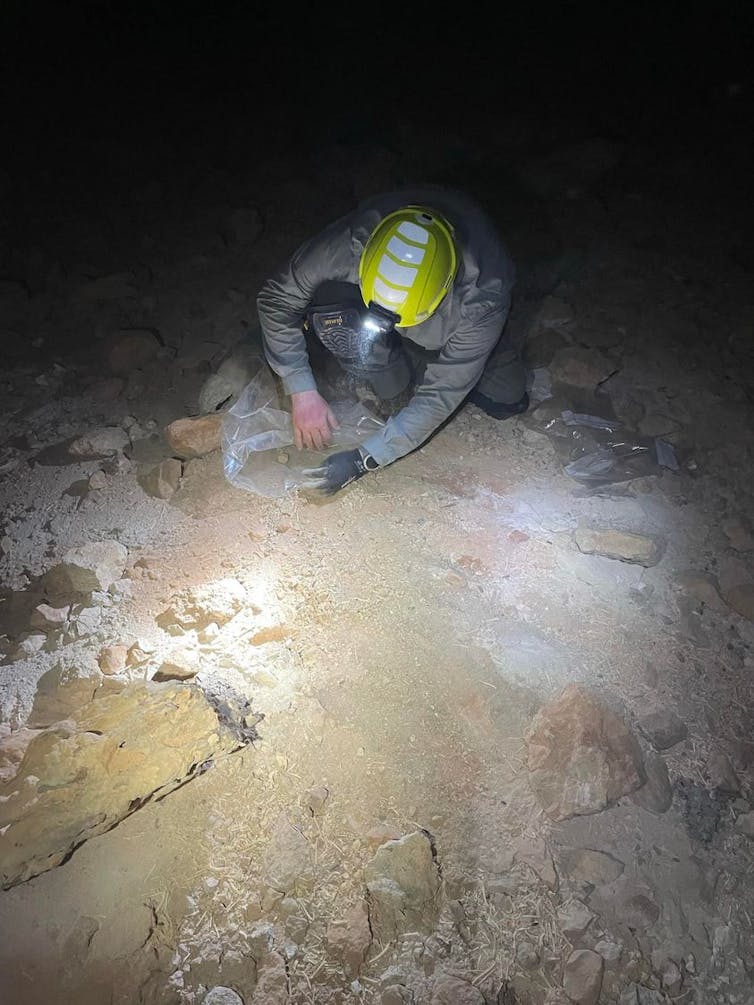
We also mounted an expedition to the caves of the Nullarbor Plain to collect additional mulgara skulls.
Not One, Two Or Three Species, But Six
Once we had assembled our collection, we measured the skulls and teeth of the mulgaras to find differences in their overall shape and size. The particular diets and habitats of particular species are expected to leave distinct patterns in their skulls and teeth.
We found differences in the skulls and teeth of mulgaras that completely revised our understanding of their diversity and recent history. Our most remarkable discoveries were found in subfossil deposits that had previously not been classified.

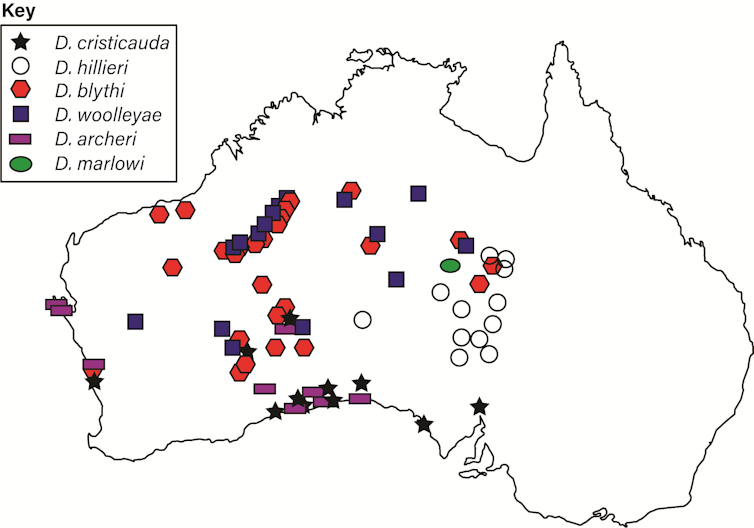
Previously, researchers disagreed about whether there are one, two, or even three species of mulgara. We found a total of six species, living in different habitats across central and western Australia. Two of these were already accepted to exist, another had been proposed in the past but dismissed, and three were entirely new.
We also found that some of the external features previously proposed for identifying species of mulgara were actually shared by multiple species.
For instance, the brush-tailed mulgara (D. blythi) and the crest-tailed mulgara (D. cristicauda) were separated based on the shape of the hairs on the end of their tails. However, it now seems that four of the six mulgara species have crested tails, while the other two have brush tails.

Just as you cannot judge a book by its cover, you cannot judge the importance of a mulgara by its size, or its taxonomy by its tail!
Four Modern Extinctions
Our research is not all good news. Of the six mulgara species, we determined that four are already extinct, likely as a result of the introduction of foxes and cats to Australia.
The extinction of these mulgara species may represent the first extinction in modern Australia within the broader family of Dasyurid marsupials, which also includes quolls and Tasmanian devils.
These newly identified mulgara disappeared with even less recognition than the now infamous extinction of their marsupial relative the thylacine, or Tasmanian tiger.
These historical extinctions and lack of awareness exemplify the current ecological crisis facing Australian mammals.
Prior to our research, it was known that mulgaras are threatened and their population and distribution across Australia has decreased.
Our research shows these declines are far greater than we thought. It also shows the importance of using subfossil records to understand the relatively recent history of marsupials for conservation. To protect Australia’s ecosystems, we will need to invest in much broader taxonomic understanding.![]()
Jake Newman-Martin, PhD candidate, Curtin University; Alison Blyth, Senior Lecturer, Curtin University; Kenny Travouillon, Curator of Mammals, Western Australian Museum; Milo Barham, Associate Professor, Earth and Planetary Sciences, Curtin University, and Natalie Warburton, Associate Professor in Anatomy, Murdoch University
This article is republished from The Conversation under a Creative Commons license. Read the original article.
We need a single list of all life on Earth – and most taxonomists now agree on how to start

Species lists are one of the unseen pillars of science and society. Lists of species underpin our understanding of the natural world, threatened species management, quarantine, disease control and much else besides.
The people who describe new species and create lists of them are taxonomists. A few years ago, a headline in the journal Nature accused the taxonomic community of anarchy for not coordinating a common view of species, leading to confusion about our knowledge of life on earth.
Many in the taxonomic community took umbrage at this. Taxonomists were concerned that the ideas proposed would limit their freedom of expression and they would be tied to a bureaucracy before they could publish new species descriptions.
Taxonomists certainly argue – disputation is essential to the practice of taxonomy, as it is to science in general. Ultimately, however, a taxonomist’s life is spent trying to discern order in the extraordinarily diverse tree of life.
The results of a new survey published today in the Proceedings of the National Academies of Science, show just how much taxonomists really do like order.
Hardly A Group Of Anarchists
The argument was about how to solve disagreements between taxonomists. Eventually, the two sides came together to produce principles on the creation of a single authoritative list of species.
This group then went to the taxonomic community to survey their views on whether a global species list is needed and how it should be run.
The newly published results show that a large majority (77%) of respondents – which included over 1,100 taxonomists and users of taxonomy across 74 countries – have expressed support for having a single list of all life on Earth.
They also agreed there should be a governance system that supports the list’s creation and maintenance. Just what that governance system would entail is not yet specified. Deciding that will be the next step in the process.

Taxonomists Propose Hypotheses, Not Facts
Why is this important? Many may not realise that when a taxonomist names a new species description, they are proposing a scientific hypothesis, not presenting an objective scientific fact.
Other taxonomists then look at the evidence provided in the description and decide whether they agree. If people making species lists judge that there is agreement about a hypothesis, the new species goes on their list.
Only after a species is listed can it be protected, studied, eradicated, ignored or whatever else governments decide is appropriate. Scientists and conservation advocates also need species to be listed before they can include them in their work. Until listed, the species remains, for all practical purposes, invisible.
However, not all lists are equally trusted. Very rarely taxonomists do go rogue. One notorious taxonomist has been blacklisted for “taxonomic vandalism”. He published all sorts of new names – some even commemorated his dog – with little justification. If accepted, his field (herpetology) would have been thrown into chaos.
The work of rogue taxonomists wastes everyone’s time and money. In one instance, poor taxonomy has even killed people – an antivenom labelled with the wrong name for a snake was distributed in Africa and Papua New Guinea with disastrous results.
Even without rogue taxonomists, there is an enormous problem with so-called synonyms – different people giving different names for the same species. Some species have tens of scientific names, not to mention misspellings.
This leaves users uncertain what name to use. Sometimes they use different names but mean the same species; sometimes the same names but mean different species. The only way to clarify this confusion is by having a working master list of species names linked to the scientific literature.

Now What?
The newly released survey shows taxonomists and users of taxonomy have achieved an agreement that good lists need good governance. Species lists need to reflect the best science, independent of outside influence. They need dispute resolution processes. And they need involvement and agreement from the taxonomic community on their contents.
Governance of science does not work unless a large majority of scientists agree with the rules, because participation is voluntary. There’s no such thing as science police.
Agreement and compliance is best achieved if scientists themselves are involved in the creation of the rules. This helps to increase buy-in among the community of peers to make sure rules are kept.
Based on the survey results, the Catalogue of Life – the group that has the most comprehensive global species list to date, and the one we’re involved in – is piloting ways of measuring the quality of the lists that make up their catalogue.
These are being trialled first with the creators of lists, everything from viruses to mammals. Then, they will be tested with the taxonomic community at large for further feedback.
Good taxonomy is far more valuable than people realise. One recent study in Australia found that, for every dollar spent on taxonomy, the economy gained A$35. The value of taxonomy globally is likely to be colossal.
But the value will be higher still if everyone the world over is able to use the same list of species.![]()
Stephen Garnett, Professor of Conservation and Sustainable Livelihoods, Charles Darwin University and Aaron M. Lien, Assistant Professor of Ecology, Management and Restoration of Rangelands, University of Arizona
This article is republished from The Conversation under a Creative Commons license. Read the original article.
Two questions, hundreds of scientists, no easy answers: how small differences in data analysis make huge differences in results

Over the past 20 years or so, there has been growing concern that many results published in scientific journals can’t be reproduced.
Depending on the field of research, studies have found efforts to redo published studies lead to different results in between 23% and 89% of cases.
To understand how different researchers might arrive at different results, we asked hundreds of ecologists and evolutionary biologists to answer two questions by analysing given sets of data. They arrived at a huge range of answers.
Our study has been accepted by BMC Biology as a stage 1 registered report and is currently available as a preprint ahead of peer review for stage 2.
Why Is Reproducibility A Problem?
The causes of problems with reproducibility are common across science. They include an over-reliance on simplistic measures of “statistical significance” rather than nuanced evaluations, the fact journals prefer to publish “exciting” findings, and questionable research practices that make articles more exciting at the expense of transparency and increase the rate of false results in the literature.
Much of the research on reproducibility and ways it can be improved (such as “open science” initiatives) has been slow to spread between different fields of science.
Interest in these ideas has been growing among ecologists, but so far there has been little research evaluating replicability in ecology. One reason for this is the difficulty of disentangling environmental differences from the influence of researchers’ choices.
One way to get at the replicability of ecological research, separate from environmental effects, is to focus on what happens after the data is collected.
Birds And Siblings, Grass And Seedlings
We were inspired by work led by Raphael Silberzahn which asked social scientists to analyse a dataset to determine whether soccer players’ skin tone predicted the number of red cards they received. The study found a wide range of results.
We emulated this approach in ecology and evolutionary biology with an open call to help us answer two research questions:
“To what extent is the growth of nestling blue tits (Cyanistes caeruleus) influenced by competition with siblings?”
“How does grass cover influence Eucalyptus spp. seedling recruitment?” (“Eucalyptus spp. seedling recruitment” means how many seedlings of trees from the genus Eucalyptus there are.)

Two hundred and forty-six ecologists and evolutionary biologists answered our call. Some worked alone and some in teams, producing 137 written descriptions of their overall answer to the research questions (alongside numeric results). These answers varied substantially for both datasets.
Looking at the effect of grass cover on the number of Eucalyptus seedlings, we had 63 responses. Eighteen described a negative effect (more grass means fewer seedlings), 31 described no effect, six teams described a positive effect (more grass means more seedlings), and eight described a mixed effect (some analyses found positive effects and some found negative effects).
For the effect of sibling competition on blue tit growth, we had 74 responses. Sixty-four teams described a negative effect (more competition means slower growth, though only 37 of these teams thought this negative effect was conclusive), five described no effect, and five described a mixed effect.
What The Results Mean
Perhaps unsurprisingly, we and our coauthors had a range of views on how these results should be interpreted.
We have asked three of our coauthors to comment on what struck them most.
Peter Vesk, who was the source of the Eucalyptus data, said:
Looking at the mean of all the analyses, it makes sense. Grass has essentially a negligible effect on [the number of] eucalypt tree seedlings, compared to the distance from the nearest mother tree. But the range of estimated effects is gobsmacking. It fits with my own experience that lots of small differences in the analysis workflow can add to large variation [in results].
Simon Griffith collected the blue tit data more than 20 years ago, and it was not previously analysed due to the complexity of decisions about the right analytical pathway. He said:
This study demonstrates that there isn’t one answer from any set of data. There are a wide range of different outcomes and understanding the underlying biology needs to account for that diversity.
Meta-researcher Fiona Fidler, who studies research itself, said:
The point of these studies isn’t to scare people or to create a crisis. It is to help build our understanding of heterogeneity and what it means for the practice of science. Through metaresearch projects like this we can develop better intuitions about uncertainty and make better calibrated conclusions from our research.
What Should We Do About It?
In our view, the results suggest three courses of action for researchers, publishers, funders and the broader science community.
First, we should avoid treating published research as fact. A single scientific article is just one piece of evidence, existing in a broader context of limitations and biases.
The push for “novel” science means studying something that has already been investigated is discouraged, and consequently we inflate the value of individual studies. We need to take a step back and consider each article in context, rather than treating them as the final word on the matter.
Second, we should conduct more analyses per article and report all of them. If research depends on what analytic choices are made, it makes sense to present multiple analyses to build a fuller picture of the result.
And third, each study should include a description of how the results depend on data analysis decision. Research publications tend to focus on discussing the ecological implications of their findings, but they should also talk about how different analysis choices influenced the results, and what that means for interpreting the findings.![]()
Hannah Fraser, Postdoctoral Researcher , The University of Melbourne; Elliot Gould, PhD student, School of Biosciences, The University of Melbourne, and Timothy H. Parker, Professor of Biology and Environmental Studies, Whitman College
This article is republished from The Conversation under a Creative Commons license. Read the original article.
Storms or sea-level rise – what really causes beach erosion?

Beaches are dynamic. They change from week to week and month to month. Have you ever wondered what causes these changes? Or how beaches might fare as sea levels rise and if storms increase in frequency and severity?
To help answer these questions, we studied 50 years of change at Bengello Beach, near the Moruya airport on the New South Wales south coast. This is a typical beach with moderate waves and no hard infrastructure such as sea walls or houses built over dunes. The results therefore represent natural beach change over half a century. This helps us understand the natural behaviour of beaches around the world.
We found the main driver of coastal erosion is frequent storms of moderate intensity. These storms remove sand from the beach. This sand is generally returned within a matter of months. But what about more extreme events?
In the 50 years of monitoring, offshore wave buoys recorded 21 storms where maximum waves heights exceeded ten metres. That’s roughly equivalent to the height of a three-story building. These larger events cause even greater erosion, so the beach takes longer to recover.
The ‘Biggest Of The Big’ Storms
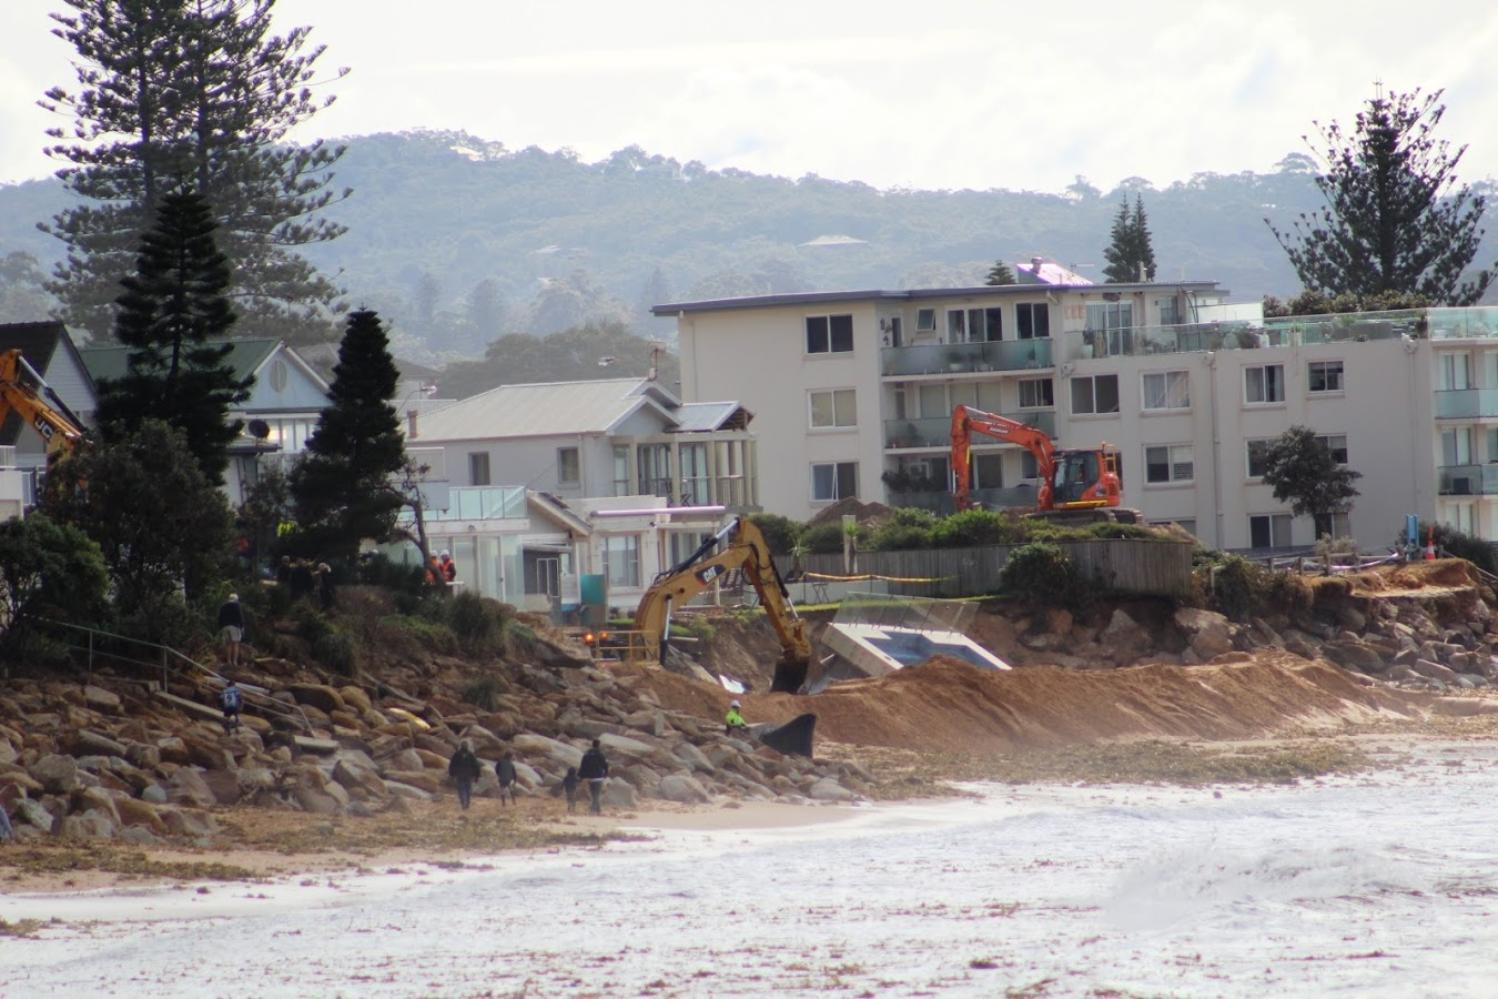
Some of the largest events in the record have been particularly destructive, for example the storm in June 2016 where a residential swimming pool washed onto the beach at Narrabeen-Collaroy. Or the June 2007 event when the Pasha Bulka container ship broke its mooring and washed up on Nobbys Beach in Newcastle. Both storms also caused substantial beach erosion at Bengello.
One sequence of storms stands out in the record. The successive storm events of May–June 1974 including the renowned Sygna Storm of May 1974. During these two months, more than a B-double truck full of sand was cut away at every metre strip of beach (95 cubic metres of sand per metre of beach), and the shoreline moved inland farther than the length of an Olympic swimming pool (63m).
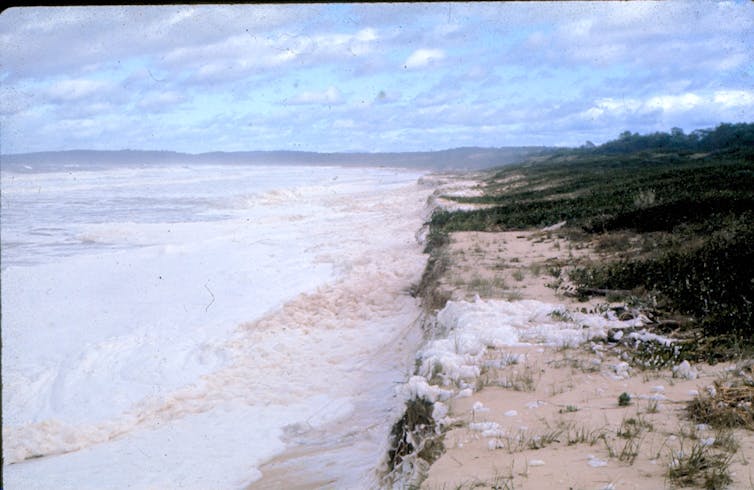
Astonishingly, it took five and half years for the beach to recover to its previous condition after these events. The recovery was hampered by more severe storms in 1976 and 1978, which interrupted the gradual build-up of beach sand.

No other storms in the record have had such a huge impact on the beach. Importantly, this is our only quantitative record of this event because it occurred before satellite imagery was available. Therefore it is not captured by tools such as CoastSat and Digital Earth Australia Coastlines, which derive shoreline positions from more than 30 years of satellite images, and have proved so powerful in understanding recent shoreline changes.
But how often do the biggest storms occur? Looking into the past, research suggests an erosion event of this magnitude has occurred at least one other time in the past 500 years.
Can Beaches Survive Future Sea-Level Rise?
So how will beaches fare in a warming world where sea-level rise accelerates and coastal storms intensify?
This beach has sufficient sand to enable recovery after extreme storm events such as those experienced in the La Niña period of 1974–78. This degree of recovery is related to each beach’s so-called “sand budget”.
Recent research has even suggested extreme storms can replenish beaches with more sand from deeper waters.
Under present-day conditions this beach appears to have the capacity to fully recover. This means that it and other similar beaches with positive sand budgets can absorb certain levels of sea-level rise – but only up to a point. There will be a threshold beyond which a beach starts to retreat unless a new source of sand is supplied.
Sources of beach sand could come from deeper water offshore or from neighbouring beaches alongshore. These “credits” of sand into the beach budget may help them maintain their current position. Other NSW beaches in credit include the northern end of Seven Mile Beach near Gerroa, Nine Mile Beach north of Tuncurry and Dark Point just north of Hawks Nest. Around Australia, we can use time-series of shoreline change to estimate beach sand budgets.
Beaches in sand “defecit” are more vulnerable to sea level rise. Examples include the southern end of Stockton Beach and Old Bar in NSW and the northern end of Bribie Island in Queensland.
In a dynamic and volatile future, it is more important than ever that we maintain long-term records of beach change. This will ensure we have a critical baseline of data to test future projections. Monthly surveys at the site are continuing.![]()
Thomas Oliver, Senior lecturer, UNSW Canberra, Australian Defence Force Academy; Bruce Thom, Emeritus Professor, University of Sydney, and Roger McLean, Emeritus Professor, UNSW Canberra, Australian Defence Force Academy
This article is republished from The Conversation under a Creative Commons license. Read the original article.
Extreme weather is outpacing even the worst-case scenarios of our forecasting models
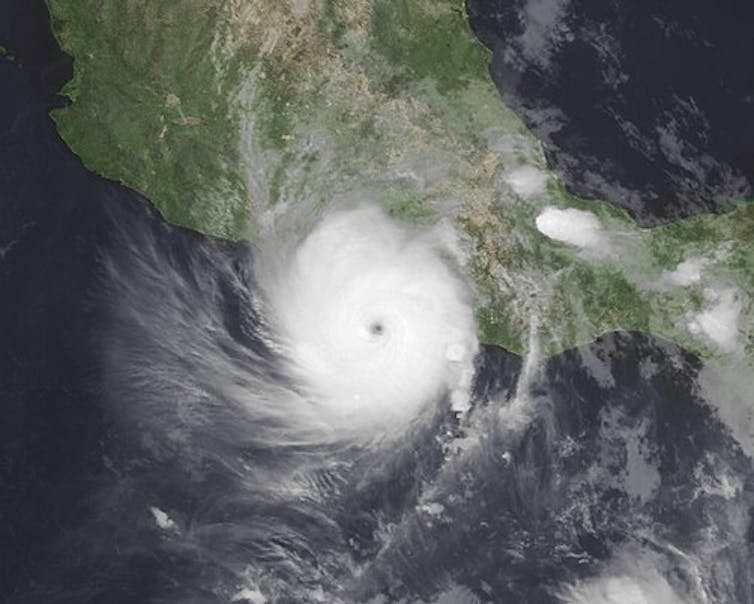
Ravindra Jayaratne, University of East LondonIn the wake of the destructive Hurricane Otis, we find ourselves at a pivotal moment in the history of weather forecasting. The hurricane roared ashore with 165mph winds and torrential rainfall, slamming into the coastal city of Acapulco, Mexico and claiming the lives of at least 48 people.
The speed at which Otis intensified was unprecedented. Within 12 hours it went from a regular tropical storm to a “category 5” hurricane, the most powerful category and one which might occur only a few times worldwide each year.
This rare and alarming event, described by the US National Hurricane Center as a “nightmare scenario”, broke records for the fastest intensification rate over a 12-hour period in the eastern Pacific. Otis not only caught residents and authorities off guard but also exposed the limitations of our current predictive tools.
I specialise in the study of natural disasters with the goal of improving our ability to predict them and ultimately to save lives. It is critical that we address the pressing concerns related to the tools we use for forecasting these catastrophic events, all while recognising the significant influence of rapid climate change on our forecasting capabilities.
The Predictive Tools We Rely On
At the core of weather forecasting are computer programs, or “models”, that blend atmospheric variables such as temperature, humidity, wind and pressure, with fundamental physics.
Since the atmospheric processes are nonlinear, a small degree of uncertainty in initial atmospheric conditions can lead to a large discrepancy in final forecasts. That’s why the general practice now is to forecast a set of possible scenarios rather than predict the single scenario most likely to occur.
But while these models are instrumental in issuing early warnings and evacuation orders, they have fundamental limitations and carry a significant degree of uncertainty, especially when dealing with rare or extreme weather. This uncertainty arises from various factors including the fundamentally chaotic nature of the system.
First, the historical data is incomplete, since a hurricane such as Otis might occur only once in several millennia. We don’t know when an east Pacific storm last turned into a category 5 hurricane overnight – if ever – but it was certainly before modern satellites and weather buoys. Our models struggle to account for these “one in 1,000-year events” because we simply haven’t observed them before.
The complex physics governing the weather also has to be simplified in these predictive models. While this approach is effective for common scenarios, it falls short when dealing with the intricacies of extreme events that involve rare combinations of variables and factors.
And then there are the unknown unknowns: factors our models cannot account for because we are unaware of them, or they have not been integrated into our predictive frameworks. Unanticipated interactions among various climatic drivers can lead to unprecedented intensification, as was the case with Hurricane Otis.
The Role Of Climate Change
To all this we can add the problem of climate change and its impact on extreme weather. Hurricanes, in particular, are influenced by rising sea surface temperatures, which provides more energy for storms to form and intensify.
The connection between climate change and the intensification of hurricanes, coupled with other factors such as high precipitation or high tides, is becoming clearer.
With established weather patterns being altered, it is becoming even more challenging to predict the behaviour of storms and their intensification. Historical data may no longer serve as a reliable guide.
The Way Forward
The challenges are formidable but not insurmountable. There are a few steps we can take to enhance our forecasting and better prepare for the uncertainties that lie ahead.
The first would be to develop more advanced predictive models that integrate a broader range of factors and variables, as well as consider worst-case scenarios. Artificial intelligence and machine learning tools can help us process vast and complex datasets more efficiently.
But to get this additional data we’ll have to invest in more weather monitoring stations, satellite technology, AI tools and atmospheric and oceanographic research.
Since even world experts and their models can be caught out by sudden weather extremes, we also need to educate the public about the limitations and uncertainties in weather forecasting.
We must encourage preparedness and a proactive response to warnings, even when predictions seem uncertain. And of course we still have to mitigate climate change itself: the root cause of intensifying weather events.
Hurricane Otis provided a stark and immediate reminder of the inadequacies of our current predictive tools in the face of rapid climate change and increasingly extreme weather events. The urgency to adapt and innovate in the realm of weather forecasting has never been greater.
It is incumbent upon us to rise to the occasion and usher in a new era of prediction that can keep pace with the ever-shifting dynamics of our planet’s climate. Our future depends on it.

Don’t have time to read about climate change as much as you’d like?
Get a weekly roundup in your inbox instead. Every Wednesday, The Conversation’s environment editor writes Imagine, a short email that goes a little deeper into just one climate issue. Join the 20,000+ readers who’ve subscribed so far.![]()
Ravindra Jayaratne, Reader in Coastal Engineering, University of East London
This article is republished from The Conversation under a Creative Commons license. Read the original article.
Taming wild northern rivers could harm marine fisheries and threaten endangered sawfish

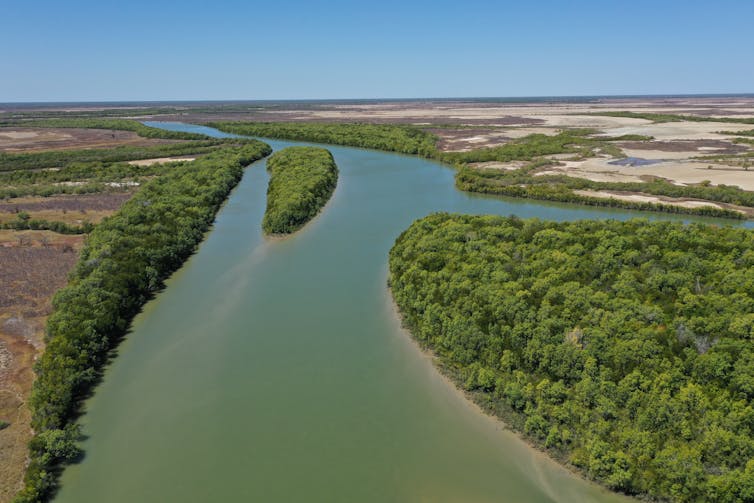
Australia’s tropical northern rivers still run wild and free. These relatively pristine areas have so far avoided extensive development. But this might not last. There are ongoing scoping studies exploring irrigating agricultural land using water from these rivers.
Our new research in the journal Nature Sustainability shows disturbing the delicate water balance upstream can have major consequences downstream, even hundreds of kilometres away.
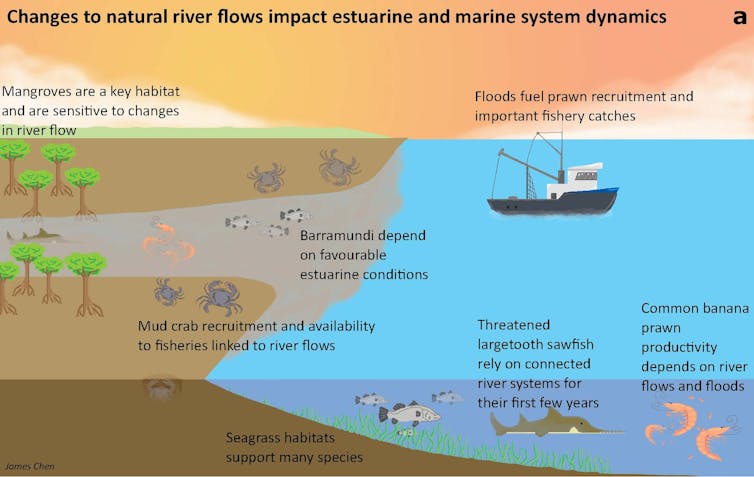
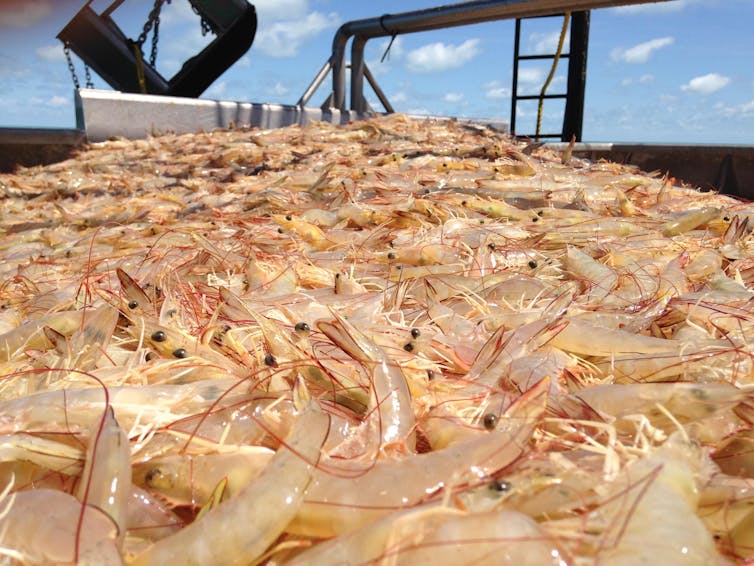
Using our latest computer modelling, we found northern water resource development would have substantial effects on prawn, mud crab and barramundi fisheries in the Gulf of Carpentaria. These are valuable Australian marine fisheries which depend on healthy estuaries. Reducing river flows would also disturb mangrove and seagrass habitats and threaten the iconic endangered largetooth sawfish.
Freshwater flows to the sea play a crucial role, boosting the productivity of marine, estuarine and freshwater systems. These complex interactions must be carefully considered in the assessment of future development plans.
Rivers Are Our Lifeblood
Worldwide, few wild running rivers remain. Their future is uncertain given growing demand for water.
Climate change is putting extra pressure on rivers as temperatures rise, rainfall patterns shift and extreme events become more frequent.
Rivers are the lifeblood of ecosystems and communities. They connect land, estuaries and the sea. But assessments of river developments often focus narrowly on local effects. They ignore the fact downstream estuaries and marine systems depend on freshwater flows. Few studies have calculated the costs of upstream catchment developments to downstream estuarine and marine ecosystems and fisheries.
We must avoid the mistakes made in southern Australia where too much water has been taken out of the system for growing crops. That means carefully evaluating the design of dams or irrigation schemes, considering when, where and how much water should be taken – and the likely trade-offs.
Why Should We Care About Northern Rivers?
Australia’s remote northern rivers are one of the last strongholds for endangered species such as the largetooth sawfish. These iconic species are born in estuaries before spending their first few years of life upstream in freshwater rivers.
Flows from these rivers also sustain extensive mangrove forests and seagrass beds. Periodic floods boost the food supply for many prized marine fisheries such as prawns, barramundi and mud crabs.
The rivers also have cultural significance for Aboriginal people and represent a valuable resource, providing food and supporting livelihoods.

Using Modelling To Connect Rivers, Estuaries And Oceans
We coupled CSIRO’s sophisticated river models with our specially tailored ecosystem models to represent how altering river flows may influence the downstream ecology and fishery yields.
We used catch data from fisheries to analyse how past natural changes in flow influenced catch rates. This was combined with extensive previous research on the biology and ecology of each species to model the dynamics of catchment-to-coast systems. We were particularly interested in the natural life cycles of fish and crustaceans in our unique northern wet-dry tropical rivers and estuaries. We then simulated multiple water resource development scenarios to assess and compare various impacts and ways to reduce them.
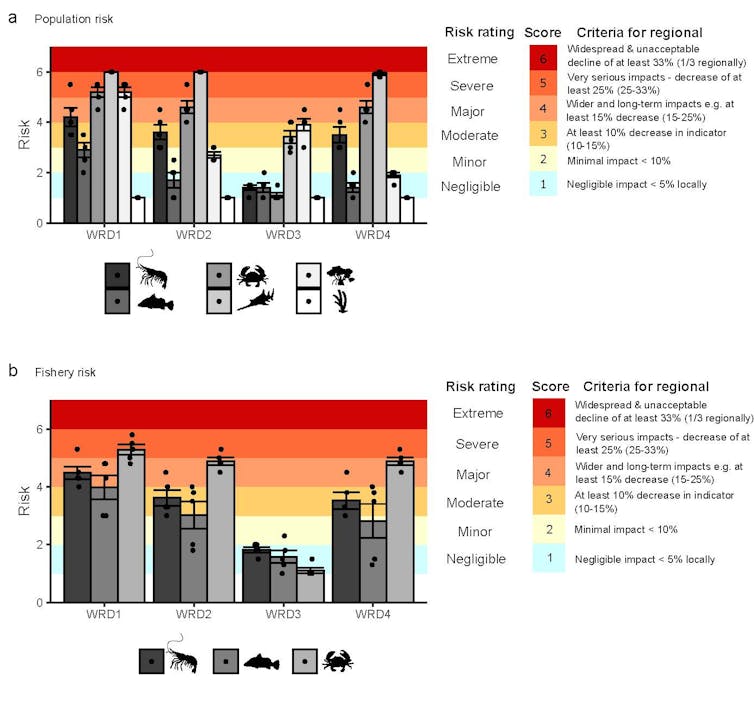
For mud crabs, we linked river flow and other climate drivers to their life cycle and were able to show how past changes in flow could explain the past variation in crab catch, particularly for rivers in which flow was seasonally variable. We could then use this model to predict how crab catch and abundance might change in the future, depending on how much water is removed from rivers and the method of removal.
Integrated Management From Catchment To Coast
Our research shows freshwater flows to the sea are crucial for environmentally and economically important species. Any plan to dam or extract freshwater from Australia’s last wild rivers should account for these effects.
Coupling scientific knowledge about marine and freshwater ecosystems with catchment development will improve infrastructure planning and flow management.
This is vital on a dry continent already challenged by climate change. Every drop counts.
The authors wish to acknowledge Annie Jarrett, Chief Executive Officer of NPF Industry Pty Ltd, which represents Northern Prawn Fishery operators, for her contribution to the research.![]()
Éva Plagányi, Senior Principal Research Scientist, CSIRO; Laura Blamey, Senior Research Scientist, CSIRO; Michele Burford, Professor - Australian Rivers Institute, and Dean - Research Infrastructure, Griffith University, and Robert Kenyon, Marine Ecologist, CSIRO
This article is republished from The Conversation under a Creative Commons license. Read the original article.
In the 1800s, colonial settlers moved Ballarat’s Yarrowee River. The impacts are still felt today
David Waldron, Federation University Australia; Kelly Ann Blake, Indigenous Knowledge, and Shannen Mennen, Indigenous KnowledgeThe discovery of gold in Ballarat in 1851 transformed its landscape to a staggering degree. Within days, and despite the news being initially suppressed, hundreds of men had gathered along the Yarrowee River.
They sluiced the clay and soil, turning the once pristine waters into what writer William Bramwell Withers described as
liquid, yellow as the yellowest Tiber flood, and its banks grew to be long shoals of tailings.
Over the next few weeks, the waterways of the Yarrowee River and of Gnarr Creek were diverted into water courses to support the search for gold.
The river was moved to make way for the town population boom, which was driven by a lust for gold. The end result was that the original, serpentine path of the river – originally across floodplains equipped to handle the natural ebb and flow of water and seasonal flooding – eventually came to be a much straighter line. Part of the river now runs underground through a tunnel.
Our new interactive map, Yarrowee River History: Peel to Prest (which takes its name from the two streets that serve as borders for the mapping), interrogates the long-term effects of this water diversion on community and Country.
A collaboration between Federation University, the Wadawurrung Traditional Owners Aboriginal Corporation and the city of Ballarat, our project overlays historical maps with Google Maps to illustrate how the area changed.
‘We Inherit The Scars Of This Trauma’
In Ballarat, water is deeply significant to the culture of the area’s First Nations inhabitants, the Wadawurrung people, who stewarded these lands and waterways for millennia.
So we wanted people using our interactive map to ponder the cultural significance of these gold rush impacts to the Wadawurrung people and the environment.
For the Wadawurrung people, the watercourse now known as the Yarrowee River carries profound historical meaning.
This river bore the names Yaramlok and Narmbool, and these names were used interchangeably to reference different segments of the Yarrowee.
The river wasn’t merely a physical entity – it was a symbol of spiritual and cultural significance, the life force which flows through Country.
It supported fishing, agriculture and food gathering. It symbolised the deep and harmonious connection with dja (Country) and the precious resource of ngubitj (water).
The river diversion affected the Wadawurrung profoundly. As two of us (Shannen Mennen and Kelly Ann Blake) write on the Yarrowee River History: Peel to Prest site:
Colonisation and mining in Ballarat led to devastation and destruction of Wadawurrung dja, including the Yarrowee River. Settlement was built upon our living spaces and as a result Wadawurrung people were displaced.
The withholding of cultural rights and obligations further increased the dispossession of our people, who were unforgivingly forced to adapt to change. Still today we inherit the scars of this trauma.
Colonial settlers altered the river
in a way which excluded the knowledge Wadawurrung people had built upon for many thousands of years […] The habitat surrounding the Yarrowee was removed or altered, damaging animal, fish and insect populations.
The destruction of the waterway continues to impact our people today. However, the spirit of this land remains within us and we continue as Wadawurrung people to live alongside the Yarrowee whilst working to restore its health and vitality.
The Wadawurrung people involved in this project hope it fosters interconnectedness between the waterway, our human ancestors, creator beings and all living things.
It is also crucial in working towards reconciliation by helping people understand the devastating environmental destruction wrought by the gold rush for the First Nations people of the region and the deep connection between culture, heritage and the landscape.
Effluent, Flooding And Typhoid
When one looks at the sheer scale of the transformation of Ballarat and district wrought by the gold rush, the level of environmental destruction is almost beyond comprehension.
Vast forested tracts of land were felled of trees, the topsoil dug up and blown away, the earth ripped open by deep tunnelling. Imported sheep began to harden the soil (disrupting native plants) and consuming the Murrnong plants, whose roots were a staple of the Wadawurrung people.
Moving the river made the area prone to disastrous flooding as water was diverted away from floodplains. Land was polluted by effluent and chemical residue from mining. This led to multiple outbreaks of disease. As one contributor to the Ballarat Star wrote at the time:
The smell from this creek for a quarter of a mile on each side is most frightful — the bed of the creek looking and smelling like the refuse pigs’ droppings mixing with their liquid manure. Nearly one-half of the children, and even adults, have been swept off between the Gnarr Creek and the Cemetery, from typhoid fever.
This project aims to draw attention to the absolute centrality of the waterways to Australia’s history and continual sustainable environmental management.
Mapping the transformation of Australia’s waterways since colonisation is crucial to understanding the long term effects of changes we make to our environment.![]()
David Waldron, Senior Lecturer in History, Federation University Australia; Kelly Ann Blake, Gherrang/Biodiversity Project Officer, Wadawurrung Traditional Owners Aboriginal Corporation, Indigenous Knowledge, and Shannen Mennen, Project Officer Wadawurrung Traditional Owners Aboriginal Corporation, Indigenous Knowledge
This article is republished from The Conversation under a Creative Commons license. Read the original article.
We must assess ‘cumulative impacts’ to protect nature from death by a thousand cuts
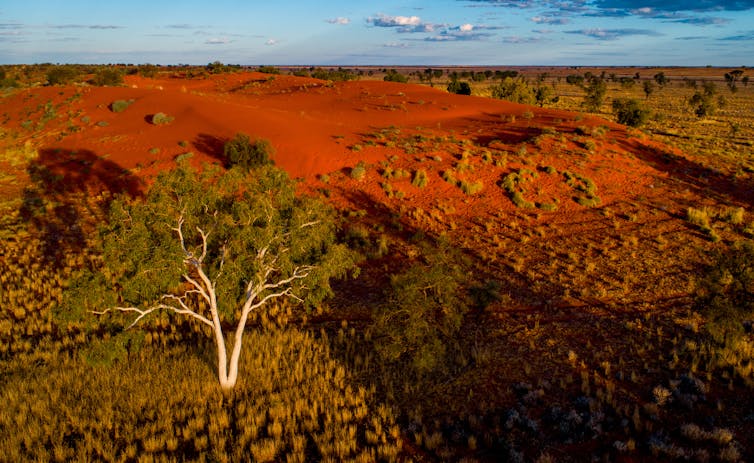
Australia’s national environment protection law ignores the big picture. Like a racehorse wearing blinkers, decision-makers focus on a single project in isolation. If they dropped the blinkers and considered the combined effects of multiple projects, they might shy away from allowing so many harmful impacts.
Urgent reform is needed because nature is suffering death by a thousand cuts. We have more than 2,000 threatened species and ecological communities – groups of plants and animals that live together and interact, such as Western Australia’s iconic Banksia woodlands. That number is likely to grow, as hundreds more await assessment for listing.
Today, the Wentworth Group of Concerned Scientists, which includes one of the authors of this article, is releasing a report outlining the practical steps needed to fix the law. It draws on both international and Australian experience to recommend pragmatic solutions that also minimise the administrative burden for landholders.
The report finds regional planning can help. But rolling out regional planning won’t happen fast, nor will it alone fix this problem. Addressing cumulative impacts on already threatened biodiversity means every impact must be counted, and countered.
Our National Environmental Laws Are Lagging
“Cumulative impacts” arise when multiple actions or environmental conditions together cause greater overall impact than threats considered in isolation.
When it comes to regulating the cumulative environmental impacts of new developments, our national environmental law is lagging.
Around the world, almost two-thirds of national environmental laws require a decision-maker to consider cumulative impacts. This includes laws in high-income economies in Europe and North America, as well as our Asia-Pacific neighbours such as Papua New Guinea, Fiji, Indonesia and the Solomon Islands. First Nations peoples often lead the charge for more focus on cumulative impacts.
Recent legal reforms in some Australian states, such as Western Australia, Victoria and the Northern Territory, and policy advances in New South Wales, do the same. But they are not set up to protect matters of national environmental significance. That’s a job for national law.
Tasmanian environmentalists sought to fix this major flaw in a legal challenge that ended in the Full Federal Court in 2015. They argued that, in approving a haematite mine that would harm the habitat of vulnerable Tasmanian devils, the federal environment minister had unlawfully failed to consider cumulative impacts.
But the challenge failed. The court decided there was no requirement to consider cumulative impacts. The then environment minister Tony Burke could continue to ignore how serious the mine’s impacts really were for the devils when combined with other major projects such as logging and neighbouring mines.

Both Big And Small Cuts Matter
Cumulative impacts are not just about major projects (such as mines) that already reach decision-makers’ desks, but also small projects that are rarely scrutinised.
Notably, very few agricultural developments seek approval. Yet for koalas, which are endangered, the cumulative effects of many land–clearing operations – mostly for grazing – is a major ongoing threat, compounded further by disease and climate change.
The federal environment department’s own advice is “even small areas of habitat loss (as little as 1 hectare) can have a significant impact” on koalas. But more than a million hectares of potential koala habitat have disappeared since the law came into force in 2000 - most with no consideration under environment law. Most land clearing continues unscrutinised.
Without attention to cumulative impacts, policy commitments to “repair nature” or be “nature positive” can’t work. It’s like trying to fill a bucket while gaping holes at the bottom are draining it.

In A Crisis, Change Is Possible
In some cases, public pressure and ecological catastrophe have forced national action on cumulative impacts.
In response to international concern for the Great Barrier Reef, a cumulative impact policy was introduced - but it only relates to the reef.
Public protests and inquiries drove Commonwealth regulation of the impact of coal seam gas and coal mining projects on water. This is currently the only “matter of national environmental significance” that requires cumulative impact assessment.
And the Commonwealth capped cumulative withdrawals of water in the Murray-Darling Basin during the Millennium Drought. For the first time across the basin, total withdrawals could not exceed an “environmentally sustainable level”. Implementation is not easy, but at least there’s now a crucial legal safeguard in place.
Overall, though, our current law is failing. The 2020 statutory review of the Environment Protection and Biodiversity Act confirmed “cumulative impacts on the environment are not systematically considered” and that this contributes to environmental decline.
What’s Holding Us Back?
Assessing cumulative impacts can be complex, so some developers and politicians will resist. But other developers will welcome better environmental performance. They know cumulative impacts can threaten an industry’s social licence to operate.
Globally, diverse industry sectors support considering cumulative impacts, from offshore wind farms in the United Kingdom, to the transport sector in the United States and the mining industry in Australia.
Dealing with cumulative impacts will also mean scrutinising types and sizes of impacts that currently fly under the national radar, but seriously impact nationally important environments.
That means cooperating with states and territories to avoid duplication of assessment and creating innovative approaches – beyond simple regulatory “sticks” – for small but cumulatively significant impacts.
Now Is The Time
Once-in-a-decade reforms to our national environmental law present an opportunity to protect nationally important species and places from cumulative impacts.
We know the Commonwealth can regulate cumulative impacts when the pressure is on. Now is the time for the Commonwealth to step up and join Australia’s states – and most of the world’s nations – in taking the legal blinkers off decision-makers assessing developments under our national law. Nature depends on it.
The authors acknowledge the contributions of Debbie Medaris, Wentworth Group of Concerned Scientists, and expert attendees of a workshop on cumulative impacts held by the Wentworth group, which have informed this article.![]()
Rebecca Louise Nelson, Associate Professor in Law, The University of Melbourne and Martine Maron, Professor of Environmental Management, The University of Queensland
This article is republished from The Conversation under a Creative Commons license. Read the original article.
Australia’s new dawn: becoming a green superpower with a big role in cutting global emissions
Rod Sims, Crawford School of Public Policy, Australian National UniversityThis article is part of a series by The Conversation, Getting to Zero, examining Australia’s energy transition.
Australia has three ways it can help reduce world greenhouse emissions, the only reduction that matters in tackling climate change.
First, we can remove emissions from our economy. This will reduce global emissions by just 1.3%, but it must be done so we share the transition burden with other countries.
Second, we can stop approving new coal and gas projects, which will raise the cost of these products and so reduce world demand for them to some extent. This would have an important demonstration effect, although the reduction in world emissions may be less than some advocates think.
Third, we can quickly pursue industries in which Australia has a clear comparative advantage in a net-zero world. Of any country, Australia is probably best placed to produce green iron and other minerals that require energy-intensive processing, as well as green transport fuels, urea for fertiliser, and polysilicon for solar panels.
Australia’s Huge Green Industry Opportunity
Of these three ways, by far the least public discussion is on the third: producing energy-intensive green exports. Yet these industries could reduce world emissions by as much as 6–9%, easily Australia’s largest contribution to the global effort. And it would transform our economy, turning Australia into a green energy superpower.
Australia produces almost 40% of the world’s iron ore. Turning iron ore into metallic iron accounts for 7% of global emissions. Our iron ore is largely processed overseas, often using Australian coal, which can be exported cheaply.
In the net-zero world, iron ore can be reduced to iron metal using green hydrogen rather than coal. Considerable renewable energy will be needed, yet renewable energy and hydrogen are very expensive to export.
Therefore, rather than export ore, renewable energy and hydrogen, it makes economic sense to process our iron in Australia, before shipping it overseas. Doing so would reduce global emissions by around 3%.
Likewise, turning Australia’s bauxite into green aluminium using low-cost renewable energy could reduce world emissions by around 1%. Making polysilicon is also energy-intensive, so again Australia is a natural home for its production. And Australian low-cost green hydrogen plus sustainable carbon from biomass are needed for making green urea and transport fuels.
From Gas And Coal Power To Clean Power
Australia is the world’s largest exporter of gas and coal taken together. Some analysts focus on the costs of losing this large comparative advantage as the world responds to climate change. They overlook two key points.
First, Australia has the world’s best combination of wind and solar energy resources, and enormous sources of biomass for a zero-emissions chemical industry.
Second, we have abundant and much-needed minerals that require huge amounts of energy to process. The high cost of exporting renewable energy and hydrogen makes it economically logical for these industries to be located near the energy source.
In other words, more of Australia’s minerals and other energy-intensive products should now be processed in Australia.
If Australia seizes this opportunity it can repeat the experience of the China resources boom of around ten years ago, but this time the opportunity can be sustained, not boom and bust, with benefits spread over more regions and people.
Some of the actions governments must take to achieve the 6–9% reduction in world emissions will also help to decarbonise our economy. We must develop the skills we need, support well-staffed government bodies to provide efficient approvals for new mines and processes, build infrastructure that will often be far from the east coast electricity grid, and maintain open trade for imports and exports.
What Government Must Do
But we also need policy changes to give private investors assistance to bridge the current cost gap between green and black products (meaning ones made by clean or by fossil fuel energy) in these new industries, and to help early movers.
If we help companies to produce these products at scale, costs will fall as processes are streamlined and technology improves. Capital grants for early movers are an option, but more work is needed to determine the best forms of support.
Let’s make a distinction between energy-intensive green products and mining. While Australia should mine the energy transition minerals the world needs – such as lithium, cobalt and rare earths – mining does not need the financial incentives just cited. Critical minerals are used in black as well as green products and Australia already has significant expertise in mining.
Some will argue Australia can wait until other countries have proven the technology and scaled up production so that the green-black price gap disappears; these new green industries will end up in Australia anyway because of our strong comparative advantage. This complacent argument has many flaws.
Australia is making decisions on its climate and economic direction now. If we do not focus on industries in which we have sustainable advantages we will end up damaging our prosperity. For example, we might pursue labour intensive industries that will be low margin and pay low wages, when other countries are better locations for them.
Second, while technology breakthroughs will be shared internationally, innovation is often about streamlining processes to suit local conditions. If we learn these lessons in Australia, we can achieve lowest-cost world production. If not, these industries could permanently locate elsewhere.
The Need For Speed
Most importantly, Australia needs to move now to put in place the incentives set out above. No other nation that has the capacity to make these energy intensive green products at scale seems focused on the task. If Australia does not do it, the reduction in world emissions could be seriously delayed.
Of all countries, Australia is best placed to show the world what is possible. Companies and countries using conventionally made steel today can say they want to use green iron but none is available. Let’s deny them that excuse.
Once the large investment, productivity and prosperity benefits of this agenda are properly explained, all Australians will applaud it.
What’s more, the level of renewable energy required by the transition will see our power prices fall to some of the lowest in the world.![]()
Rod Sims, Professor in the practice of public policy and antitrust, Crawford School of Public Policy, Australian National University
This article is republished from The Conversation under a Creative Commons license. Read the original article.
Worried economists call for a carbon price, a tax on coal exports, and ‘green tariffs’ to get Australia on the path to net zero
Peter Martin, Crawford School of Public Policy, Australian National UniversityAustralia’s top economists have overwhelmingly backed the reintroduction of the carbon price that helped cut Australia’s emissions between 2012 and 2014.
The government concedes that achieving its legislated emissions reduction target of 43% below 2005 levels by 2030 and net zero by 2050 will be difficult. With official forecasts showing Australia falling short, the Economic Society of Australia asked 50 leading Australian economists what should be done to speed things up.
Offered a choice that included nuclear energy, accelerated investment in large-scale batteries, and a rapid phase-out of traditionally fuelled vehicles, 30 of the 50 picked a carbon price of the kind introduced by the Gillard Labor government in 2012 and abolished by the Abbott Coalition government in 2014.
Another five said they supported an economy-wide carbon price, but wouldn’t nominate it in the survey because it would face “significant political hurdles” and would not be “politically feasible”.
The Department of Climate Change told the government in December it was on track to fall short of its 2030 target of a 43% cut on 2005 levels, but that with “additional measures” it could get to 40%.
In October this year, Climate Change and Energy Minister Chris Bowen described the 43% target as “ambitious” and a “difficult task”.
The scheme the economists were asked about was a “cap and trade” scheme, of the type common in much of the world. In these schemes, the government sets a cap on the total number of emission permits produced each year and allows users to trade them with one another to set a price.
A Carbon Price By Another Name
The Gillard government’s scheme was initially a fixed charge per tonne of carbon emitted by big polluters. It was set to switch to a cap and trade scheme after three years, but ended up being abolished after two.
In its place, the Abbott government created a “safeguard mechanism” that currently applies only to the 219 biggest polluting facilities in Australia. It requires each to keep emissions below a government-set baseline, and allows them to trade emissions reductions with one another.
The economists were asked about expanding the mechanism to make it mimic an economy-wide carbon price. In response, 42% said they wanted to boost the number of facilities it covered, and 26% wanted to tighten the baselines to push up the price.
All but seven of the 50 economists wanted either an economy-wide carbon price or an expanded safeguard mechanism that would act as one.
Independent economist Hugh Sibly said it might well be that nuclear, hydrogen or other sources of energy were the most efficient ways of decarbonising the economy, but it would be impossible to know until Australia started charging for emitting carbon and allowed the market to work out the cheapest way of coping.
Half of those surveyed wanted to expedite the building of new transmission lines to link places where electricity was being produced with places where it would be needed. One-third wanted expedited investment in large battery storage.
Economists including Macquarie University’s Lisa Magnani justified this by saying it was necessary for the government to move in ahead of the private sector to provide the infrastructure the private sector would need in order to decarbonise “within the time left to act seriously”.
No New Mines, Taxes On Exports From Existing Mines
Many experts surveyed wanted bolder measures than those proposed by the Economic Society of Australia.

Former OECD official Adrian Blundell-Wignall said Australia’s coal exports create almost two and a half times the emissions Australians produce domestically.
“What is the point of moving to net zero on the latter while we do nothing on coal exports?” he asked.
His proposal, aired in the Australian Financial Review, is for Australia to tax exports of the metallurgical coal used to make steel, forcing up the price and reducing global demand. Australia has 55% of the market.
If higher prices brought in more tax and resulted in less burning of metallurgical coal, it would be a win-win for Australia and the world.
Mark Cully, a former chief economist at the Australian industry department, said Australia should follow the lead of France, Denmark and Sweden and ban new fossil fuel projects.
The supply restriction would push up the relative price of fossil fuels and encourage a faster global take-up of renewable energy.
Impose Green Tariffs On Dirty Imports
Australia should also join the European Union in implementing a green tariff, the so-called Carbon Border Adjustment Mechanism that imposed an emissions tax on imported goods whose emissions were not taxed in the country in which they were produced.
Cully said too much of Australia’s concern was directed to energy, a sector where emissions are genuinely beginning to fall. In other sectors, emissions have plateaued or are even rising, making it “inconceivable that Australia can meet its 43% reduction target by 2030, let alone net zero by 2050, without other high-volume emissions sectors contributing”.
Frank Jotzo, director of the Centre for Climate Economics at the Australian National University, said carbon pricing has to be complemented by targeted measures aimed at industries such as transport, building, agriculture and reforestation.
He said Australia will soon need to back measures that suck carbon dioxide back out of the atmosphere, acknowledging that many emissions will continue and will therefore need to be offset in order to get to net zero.
Critical Opportunity, But Critical Challenge
University of Tasmania economist Joaquin Vespignani said state and federal governments should “invest” in the production of the so-called critical minerals that will be needed for decarbonisation via tax deductions.
Australia has more than 20% of the proven global reserves of minerals such as lithium that are essential for clean energy production and storage.
Michael Knox of Morgans Financial noted the International Agency believed the world would need to ramp up its production of critical minerals to three times its present level by 2030.
Energy investment would need to double, and electricity transmission grids would need to roll out an extra two million kilometres of wire per year.
The Agency described the task as Herculean. Knox said it was far from certain to be achieved.
Individual responses. Click to open:
![]()
Peter Martin, Visiting Fellow, Crawford School of Public Policy, Australian National University
This article is republished from The Conversation under a Creative Commons license. Read the original article.
Solar power expected to dominate electricity generation by 2050 – even without more ambitious climate policies
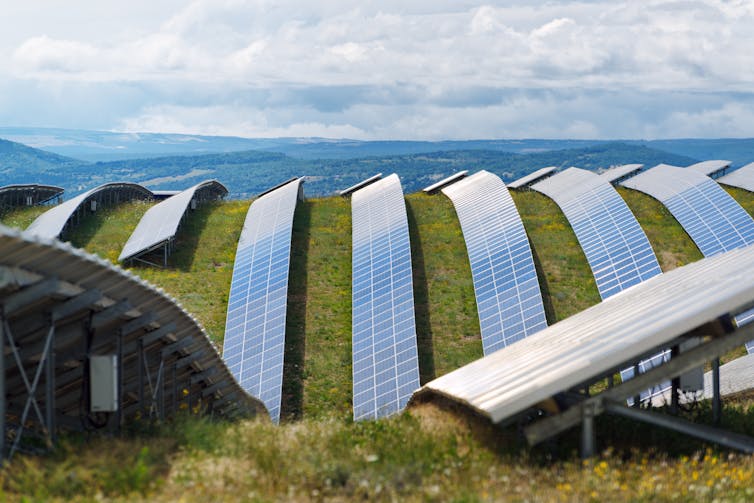
In pursuit of the ambitious goal of reaching net-zero emissions, nations worldwide must expand their use of clean energy sources. In the case of solar energy, this change may already be upon us.
The cost of electricity from solar plants has experienced a remarkable reduction over the past decade, falling by 89% from 2010 to 2022. Batteries, which are essential for balancing solar energy supply throughout the day and night, have also undergone a similar price revolution, decreasing by the same amount between 2008 and 2022.
These developments pose an important question: have we already crossed a tipping point where solar energy is poised to become the dominant source of electricity generation? This is the very question we sought to address in our recent study.
Our findings, which were obtained by plugging the latest technological and economic data from 70 regions across the globe into a macroeconomic model, suggest that the solar revolution has, indeed, arrived. Solar energy is on track to make up more than half of global electricity generation by the middle of this century – even without more ambitious climate policies.
This projection far exceeds any previous expectations. In 2022, the International Energy Agency’s World Energy Outlook report predicted that solar energy would account for a mere 25% of electricity production by 2050.

Solar And Storage Cheapest By 2030
We identified two key factors that will drive the rapid expansion of solar energy: its affordability and swift construction timeline. The construction of a solar farm usually takes just one year to complete. In comparison, offshore wind farms can take up three years to construct.
The faster construction of solar farms allows investors to take advantage of their cost-effectiveness sooner than they would be able to do with offshore wind farms (and many other renewable energy infrastructures).
We see the interplay of these factors forming a self-reinforcing cycle. As producers and installers gain more experience, prices are projected to continue their decline. This will render solar energy an even more attractive prospect for investors.
Our projections suggest that the average cost of generating electricity through solar energy will decrease substantially, by 60% from 2020 to 2050, even when factoring in the growing demand for energy storage.
Should these forecasts prove accurate, solar energy combined with storage is expected to become the cheapest option for generating electricity in nearly all regions worldwide by 2030. In that same year, it is expected to be 50% less costly than constructing new coal-fired power plants in six major regions: the EU, US, India, China, Japan and Brazil.
Countries that continue to construct fossil-based infrastructure run the risk of putting their electricity-intensive sectors at a significant competitive disadvantage. Consequently, we must question whether it is realistic to rely on fossil fuels for the power sector. The future appears to be beckoning in a more sustainable direction.
Solar is becoming the cheapest option for generating electricity

But Barriers Remain
The rapid expansion of solar is very likely, and could lead to exceptionally affordable electricity. However, several hurdles must be overcome to ensure that solar’s ascent can be sustained.
Solar energy is highly variable, dependent on factors like the time of day, season and weather conditions. To accommodate this variability, electricity grids must be designed with flexibility in mind. This will require extensive energy storage, an expanded network of transmission cables linking different regions, and more investment in complementary renewable energy sources like wind.
In a future where solar energy dominates, there will also be a substantial demand for various critical metals and minerals. In fact, the International Energy Agency predicts that, by 2040, renewable technologies will account for approximately 40% of the total demand for copper, between 60% and 70% for nickel and cobalt, and nearly 90% for lithium.
To ensure a steady future supply of essential materials, recycling initiatives will have to be developed further. Global mining activities must be diversified too. This will help spread the risks associated with concentrating mining activities in unstable regions.
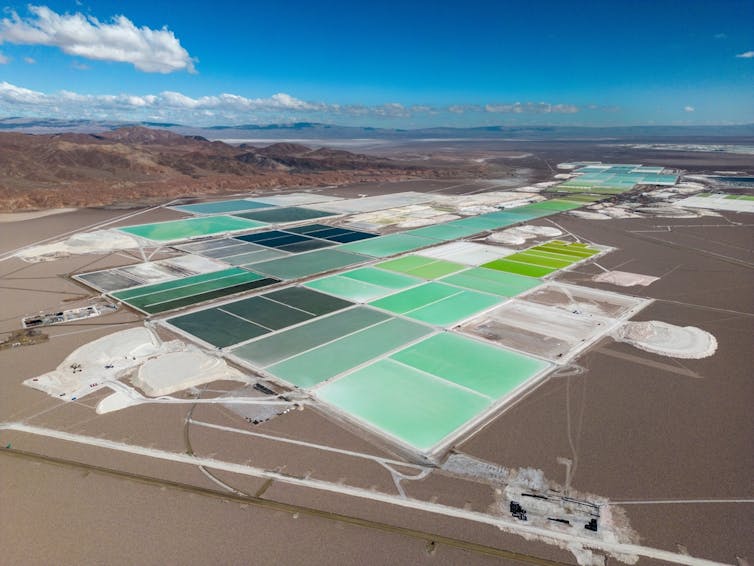
Access to financial resources is a critical factor in sustaining the growth of solar. But, at present, the bulk of climate-related funding is concentrated in developed or emerging economies.
Between 2011 and 2020, 75% of all climate finance was channelled into North America, western Europe and east Asia (primarily led by China). Africa, one the other hand, received only 5% of total global climate finance over the same period.
One potential avenue to bridge this funding gap is the implementation of mechanisms that absorb currency and investment risks in developing countries, thereby unlocking international capital flows.
The solar revolution has arrived. Countries and regions that do not incorporate renewables into their energy risk losing their competitive edge, particularly within their industrial sectors. To remain at the forefront, nations should not just maintain their current progress but rather accelerate their efforts to integrate solar energy into their grids, supported by investments in complementary technologies.
By doing so, they can avoid the looming risk of new coal and gas plants becoming obsolete and financially burdensome stranded assets. The sun is rising on a new era of energy – the time to embrace it is now.

Don’t have time to read about climate change as much as you’d like?
Get a weekly roundup in your inbox instead. Every Wednesday, The Conversation’s environment editor writes Imagine, a short email that goes a little deeper into just one climate issue. Join the 20,000+ readers who’ve subscribed so far.![]()
Nadia Ameli, Principal Research Fellow at the Institute for Sustainable Resources, UCL; Femke Nijsse, Lecturer at Global Systems Institute, University of Exeter, and Jean-Francois Mercure, Associate Professor in Climate Change Policy, University of Exeter
This article is republished from The Conversation under a Creative Commons license. Read the original article.
Fire-smart farming: how the crops we plant could help reduce the risk of wildfires on agricultural landscapes
Tim Curran, Lincoln University, New Zealand; Md Azharul Alam, Lincoln University, New Zealand; Tanmayi Pagadala, Lincoln University, New Zealand, and Thomas Maxwell, Lincoln University, New ZealandDestructive wildfires continue to threaten lives, property and the environment throughout the world.
Around 10% of all fires globally occur on agricultural land, causing damage to crops, infrastructure and nearby native vegetation.
But what if the properties of the plants grown on agricultural land could be harnessed to help mitigate fires?
Our research tested this idea and found that many common crops and pastures are low in flammability and could be used to redesign agricultural landscapes to help suppress wildfires.
Food Crops, Fires And Biodiversity
Globally, 38% of the land surface is used for cropping or grazing. Agricultural produce is a key commodity of many countries.
Agricultural fields are a major source of wildfire, either through the escape of fires lit deliberately for agricultural purposes (stubble burning) or through accidents (ignited from machinery use). There is a clear need to better mitigate fires in agricultural landscapes.
Agricultural landscapes are also very important for native biodiversity. Diversification of agricultural systems could not only help mitigate wildfires, but also aid food production and promote biodiversity conservation.
However, to do this, we first need to understand the flammability of different crop species.
Crop and pasture species are likely to vary widely in their flammability. For instance, in Brazil, pineapple crops were much better at stopping fires than peanuts or grazing legumes. In Canada, a pasture mix of yarrow, white clover and Rocky Mountain fescue experienced less intense and slower-moving fires than those that burned through nearby grasslands.
A modelling study has even suggested that planting “edible fire buffers” of bananas might be useful to mitigate fires in California.
While these mostly field-based studies have been very useful, we still needed to compare the flammability of a wide range of crop and pasture species to identify which ones could be planted to help mitigate fire hazards. To do this, we turned to our “plant BBQ” method.
Testing Crop Flammability
Our plant BBQ, based on an Argentinian design, measures the flammability of shoots and whole plants up to 70cm in length. Results from this technique were correlated with the observations made by fire managers when attending fires.
This is an approach used widely around the world, including in New Zealand, New South Wales, Queensland, South Africa, the United States and Brazil.
For our study, we identified 47 different plant species or varieties that commonly occur on farms in New Zealand’s Canterbury region. These included many crop and pasture species grown in temperate regions around the world, such as cereal crops (wheat, oats, barley, popcorn), forage crops (beet, kale, sweetcorn, rapeseed), fruit crops (apples, olives, pears, blueberries, raspberries), grazing herbs (chicory, plantain), various pasture grasses (cocksfoot, ryegrass) and pasture legumes (clovers, lucerne), vegetables (bell pepper, snow peas, potato, onion, squash) and several wine grape varieties.
So, what did we find?
First, many species found on farms are low in flammability. Indeed, 24 (51%) of the varieties we tested did not ignite at all. These included many vegetable crops, pasture species (lucerne, clovers, some grasses) and wine grapes.
Second, there were also species with comparatively high flammability. As expected, cereal crops such as wheat and oats, which brown off late in their life cycle and retain a lot of dead material, were relatively highly flammable.
Unexpectedly, fruit crops, such as pears and two apple varieties, had the highest flammability. Raspberries had similar flammability to wheat and oats.
These results show there is large variation in the flammability of species found on farms. This suggests that planting fire-retardant crop and pasture species could be a useful tool to strategically redesign agricultural landscapes to help mitigate wildfires in an increasingly fire-prone world.
Fighting Fire With Food
How might we use these findings to mitigate wildfires in agricultural landscapes? First, we should recognise some caveats to our work. While our plant BBQ method likely provides good estimates of whole-plant flammability, many other variables will determine fire behaviour in the field. This includes weather and topography.
Hence, these findings should be tested using experimental burns of crops in paddocks. Modelling could help here, too. It is also important to repeat our testing in different locations, with different agricultural practices and across seasons to determine how these factors affect flammability.
With this knowledge on comparative plant flammability we can start to redesign agricultural landscapes.
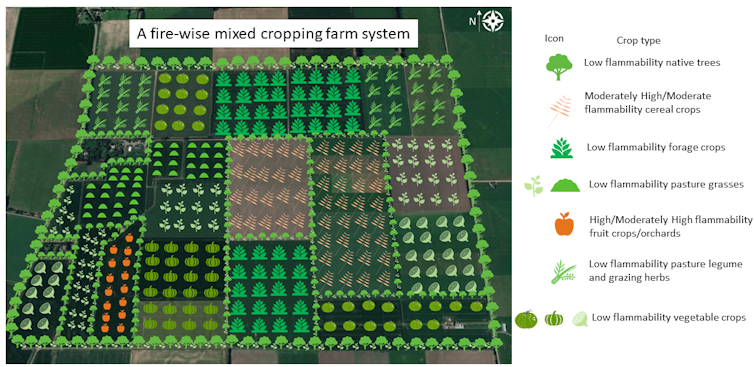
Green firebreaks comprised of low-flammability native species could be planted around the farm perimeter and around particularly important assets such as houses. Crops with higher flammability could be embedded among other paddocks planted with low-flammability crops.
Given the expanding use of the plant BBQ technique globally, we expect that such research can readily be conducted elsewhere, including in the tropics and other regions at risk of wildfires.![]()
Tim Curran, Associate Professor of Ecology, Lincoln University, New Zealand; Md Azharul Alam, Postdoctoral Research Fellow, Lincoln University, New Zealand; Tanmayi Pagadala, Resource Management Planner, Lincoln University, New Zealand, and Thomas Maxwell, Senior Lecturer in Grazing Lands Ecology, Lincoln University, New Zealand
This article is republished from The Conversation under a Creative Commons license. Read the original article.
Climate adaptation projects sometimes exacerbate the problems they try to solve – a new tool hopes to correct that
Ritodhi Chakraborty, University of Canterbury and Claire Burgess, University of CanterburyWhen United States aid money was used to build a seawall on Fiji’s Vanua Levu island to shield the community from rising tides, it instead acted as a dam, trapping water and debris on its landward side.
In another example from Bangladesh, the World Bank is pouring US$400 million into expanding old flood barriers along the coastline to counter climate-induced floods and sea-level rise. But this, too, is causing new problems, including waterlogged fields and loss of soil fertility.
Across the globe, a “climate adaptation industry” sometimes imposes solutions that exacerbate the problems they aim to solve. Frequently, this comes at the cost of vulnerable communities.
This story plays out across the world, including in Aotearoa New Zealand, where top-down adaptation projects can increase climate vulnerability of communities. Our work seeks to fill a critical gap by establishing a monitoring and evaluation system to identify the risk of maladaption.
Maladaptation Is A Growing Problem
Concern about unforeseen consequences of climate adaptation has emerged as a key issue in the latest report by the Intergovernmental Panel on Climate Change (IPCC). Authors noted that:
Evidence of maladaptation is increasing in some sectors and systems, highlighting how inappropriate responses to climate change create long-term lock-in of vulnerability, exposure and risks that are difficult and costly to change and exacerbate existing inequalities for Indigenous peoples and vulnerable groups.
Maladaptation is usually understood as referring to the unintended consequences of well-meant measures to reduce climate vulnerability. But it also includes the fallout from decisions that favour technical fixes over more holistic approaches.
Climate adaptation is not a neutral or apolitical process. It can perpetuate problematic approaches, including colonial land practices and the exclusion of Indigenous voices.
This can create tenuous resource distribution, erode democratic governance and compromise Indigenous sovereignty, exacerbating vulnerabilities. It can also subvert community-driven bottom-up adaptation, instead focusing on national agendas caught up in international politics.
Addressing these maladaptive strategies is pivotal for achieving climate justice.
The Situation In Aotearoa New Zealand
In New Zealand, climate change adaptation research is still in its early stages.
Most adaptation projects are being designed and implemented in three key categories: flood protection (stop banks and erosion control), nature-based solutions (tree plantings and wetland restoration) and coastal hazard prevention (managed retreat and sea walls).
These efforts often follow a framework of “dynamic adaptation policy pathways” (DAPP). This means the planning process has to remain flexible to keep adjusting as new information comes to hand.
However, a recent symposium on the ten-year stocktake of this approach raised several critical points, including:
the need to involve Māori and local communities more throughout the process
share governance across all levels of government
address funding barriers for implementation
and avoid investments that lock in problems for the future.
Take for instance the stalled Clifton to Tangoio coastal hazards strategy in the Hawke’s Bay. This project aimed to identify the areas most at risk of coastal flooding and erosion.
It was hindered by policy ambiguity and funding issues. The region now faces decisions about managed retreat because land was classified as uninhabitable after Cyclone Gabrielle.
Others have noted the lack of synergy between planned and community-driven climate adaptation activities. Council-planned measures often exacerbated climate vulnerability, especially for communities already living in disadvantaged areas.
Addressing Maladaptation
We came together as a group of Māori, Pasifika, Pākehā and tauiwi scholars and practitioners to develop a maladaptation assessment tool for New Zealand.
Its aim is genuine sustainability and justice. It evaluates the risk of maladaptation and serves as the foundation for a national monitoring system with both regulatory and educational roles.
Our goals are to illuminate and ideally correct overlooked social and ecological impacts of climate adaptation and to address the limitations of current audit systems. These often neglect local justice and wellbeing concerns in favour of centrally planned projects aimed at reducing risks identified by engineering and insurance industries.
Our preliminary findings from the analysis of 79 adaptation projects show that managed retreat, structural flood protection and climate-resilient development projects are most at risk of maladaptation.
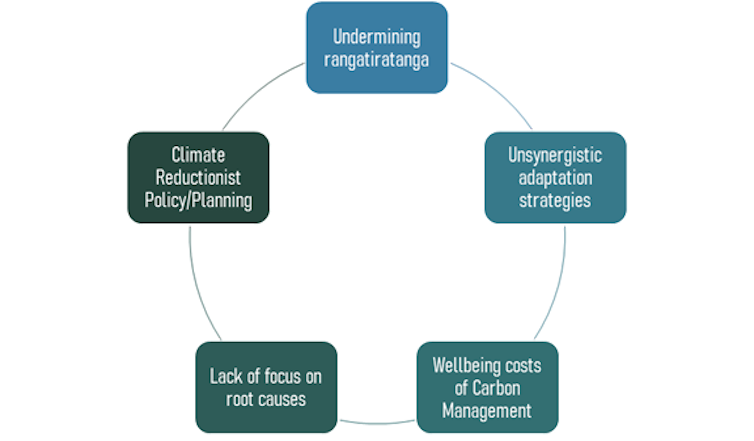
To be just, climate adaptation requires a counter-intuitive approach. It should prioritise community wellbeing and examine the risks posed by both climate change and adaptation.
This perspective doesn’t diminish the reality of climate impacts. It contextualises them within a complex history of Indigenous displacement, forced landscape alteration and ongoing social crises.
By addressing the threat of maladaptation, we hope to encourage thinking and planning that looks beyond mere technological fixes and begins to repair our broken relationships with the planet and each other.![]()
Ritodhi Chakraborty, Lecturer of Human Geography, University of Canterbury and Claire Burgess, Research Assistant, University of Canterbury
This article is republished from The Conversation under a Creative Commons license. Read the original article.
El Niño may be drying out the southern hemisphere – here’s how that affects the whole planet

It is a well-known fact that water is the key to life on Earth. But it is less well known that only about 1% of all water on the planet is fresh water available to humans, plants or land-based animals.
The rest is in the oceans, or locked up in polar ice sheets and rocks. In a climate changing world, the global distribution of that 1% takes on a whole new significance.
A new study has shown that the southern hemisphere has been drying out more than the northern hemisphere over the past two decades (2001-2020). The authors suggest the principle cause is the weather phenomenon known as El Niño, which occurs every few years when ocean water in the eastern Pacific is warmer than usual.
The findings are based on data from satellites and measurements of river and stream flows, which enabled the authors to model and calculate changes in water availability. Water availability is the net difference between the amount of water supplied to the landscape, in the form of rainfall on land, and the water removed to the atmosphere by general evaporation or by plants through their leaves.
Even though the southern hemisphere has only a quarter of the global land area (excluding Antarctica), it appears to have a substantially greater effect on global water availability than the northern hemisphere.
The new analysis reveals a strong decrease in water availability in South America, most of Africa, and central and northwestern Australia. However, some regions such as the southern part of South America will have more water available.
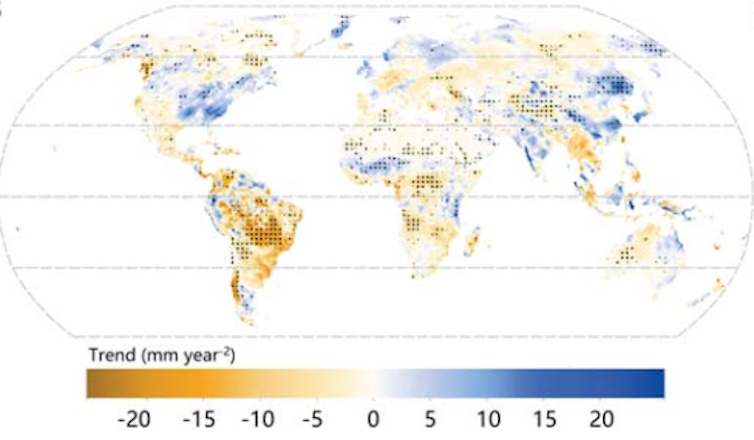
By contrast, despite significant variations between regions, the study suggests water availability in the northern hemisphere is more or less balanced. This is in part due to extensive human influences such as irrigation, dams and food production. Such factors are more relevant in the northern hemisphere since about 90% of the world population lives there.
But why does any of this rather technical modelling about water availability and drying matter? What are some possible implications if the southern hemisphere is drying out more than the northern?
What Happens In The South Affects The North Too
Part of the answer lies in the regions likely to experience increased drying. South America includes the Amazon rainforest, which is a key regulator for the climate, as well as a globally important habitat for species and home to many Indigenous communities.
Drying of the rainforest would reduce vegetation and increase the risk of fire. This would be bad news for humans and animals that live in the forest, and has the potential to release billions of tons of carbon currently locked into forest vegetation and soils.
South America is also a major agricultural exporter of soybeans, sugar, meat, coffee and fruits for the global market. Changes in water availability will increase stress on food systems globally.
Drying across most of Africa is also a real challenge. This huge continent has many climatic zones and socio-economic contrasts, with often limited resources to mitigate and adapt.
Pressures on food systems and habitats will create additional stresses across the continent which is already suffering from increases in global food prices linked to inflation and the war in Ukraine.
Yields of the staple cassava have been declining due to droughts. And exports such as coffee and cocoa could also be reduced, leading to a spiral of loss of livelihoods, poverty and hunger.
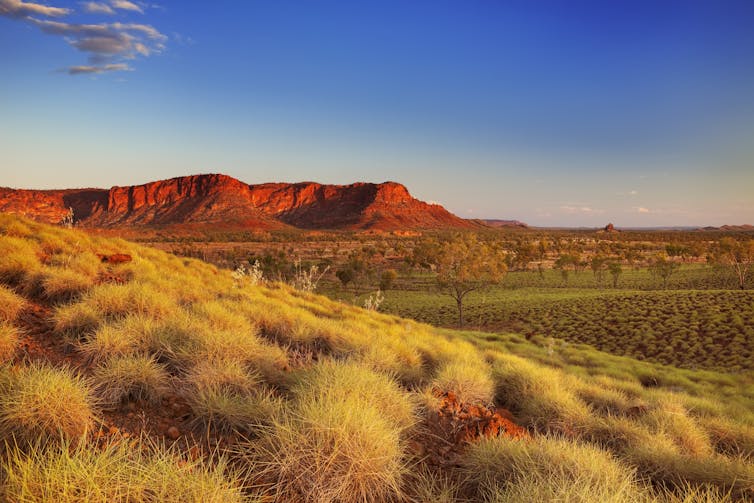
North-west Australia is one of the country’s great wildernesses. But it would be a major error to consider the region “empty” and therefore unimportant in terms of drying. (Like most environmental issues and concerns, it is rarely advisable to isolate one aspect from another.)
Drying will change vegetation patterns and further increase temperatures, which could be above 35°C for large parts of the year by 2100 if emission rates continue to be high. This would have severe effects on the health of humans and habitats.
Similarly, drying in central Australia has knock-on effects on weather and climate for coastal areas where most of Australia’s major cities and population are situated. Drying trends are also being experienced in the south-west and south-east of the country leading to habitat stresses and change, wildfires, depleted rivers and impacts on human health, especially in urban areas.
As with many aspects of climate, the exact nature and scale of changes and impacts are hard to predict or model at local or regional scales. But this new paper points to clear shifts in patterns and complex climate processes in the southern hemisphere which will reduce water availability during El Niño events.
Drying will generate additional stresses on habitats and species in key regions. It will also impact human populations with varying capacities to adapt and, ultimately, our global food systems. Although the southern hemisphere is mostly water, what happens there really matters for the whole planet.

Don’t have time to read about climate change as much as you’d like?
Get a weekly roundup in your inbox instead. Every Wednesday, The Conversation’s environment editor writes Imagine, a short email that goes a little deeper into just one climate issue. Join the 20,000+ readers who’ve subscribed so far.![]()
Kevin Collins, Senior Lecturer, Environment & Systems, The Open University
This article is republished from The Conversation under a Creative Commons license. Read the original article.
Forests are vital to protect the climate, yet the world is falling far behind its targets
The world is falling behind on commitments to protect and restore forests, according to the recent Forest Declaration Assessment. There is no serious pathway to fixing climate change while forest losses continue at current rates, because global climate targets, sustainable development goals and forest commitments depend on each other.
But it isn’t too late. The Assessment was published alongside the Forest Pathways Report I led for conservation organisation the WWF, which sets out a blueprint for how we turn our global forest failures around and get on track to protected, restored and sustainably managed forests.
Around 1.6 billion people live close enough to forests to depend upon them for their livelihoods, and forests suck down about a third of our CO₂ emissions from fossil fuels.
The UN estimates that forests directly generate US$250 billion (£206 billion) in economic activity a year. Their broader, indirect, value might be as much as US$150 trillion (£12 trillion) per year – double the value of global stocks – largely due to their ability to store carbon. Despite this, subsidies still provide incentives for people to convert forests into agriculture.
Failing Promises
There have been multiple global commitments to forests, with hundreds of governments and businesses signing up to pledges named after cities they were signed in: Bonn in 2011, New York in 2014, Glasgow in 2021. But these pledges have not been realised, and deforestation reduction targets are slipping each year.
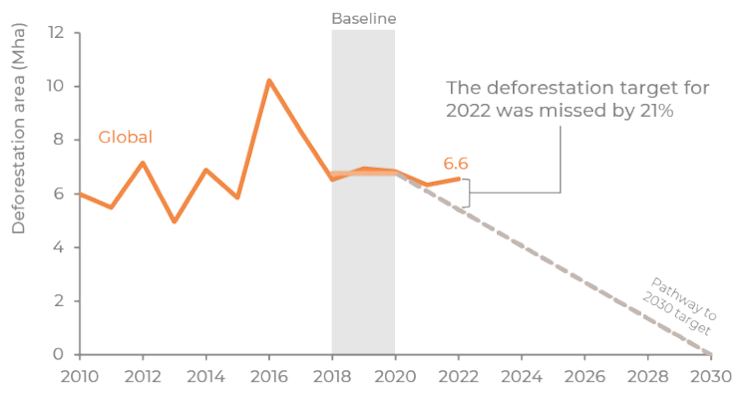
Global forest loss in 2022 was 6.6 million hectares, an area about the size of Ireland. That’s 21% more than the amount that would keep us on track to meet the target of zero deforestation by 2030, agreed in Glasgow. The loss of tropical rainforest is even more pronounced: 33% over the target needed. Deforestation in 2022 marked a 4% step back on 2021 progress.
Why We Are Failing To Protect Forests
There isn’t one simple explanation for why forests are still disappearing. Factors include a lack of Indigenous Peoples rights to their territories, forest-harming financial and trade systems, and the physical effects of climate change and fire.
The lack of consistent and secure land tenure rights for Indigenous Peoples and local communities threatens forests and the people who depend upon them. Across the tropics, where forests are under their stewardship, the evidence is clear: deforestation and degradation are lower.
Subsidies that can lead to deforestation are worth between US$381 billion (£314 billion) and US$1 trillion (£825 billion) per year. These could include handing out public land to settlers, building roads or pipes to enable industrial-scale farming, keeping taxes on agricultural products artificially low, or subsidies on specific crops grown on formerly forested lands.
There are also illegal activities. By one recent estimate, 69% of the tropical forest cleared for agriculture between 2013 and 2019 violated national laws and regulations. The illegal timber trade is estimated to be worth US$150 billion per year globally.
There is simply not enough money going to support forests. Public finance for forests is less than 1% “”) of the amount invested in activities that are environmentally harmful or incentivise deforestation.
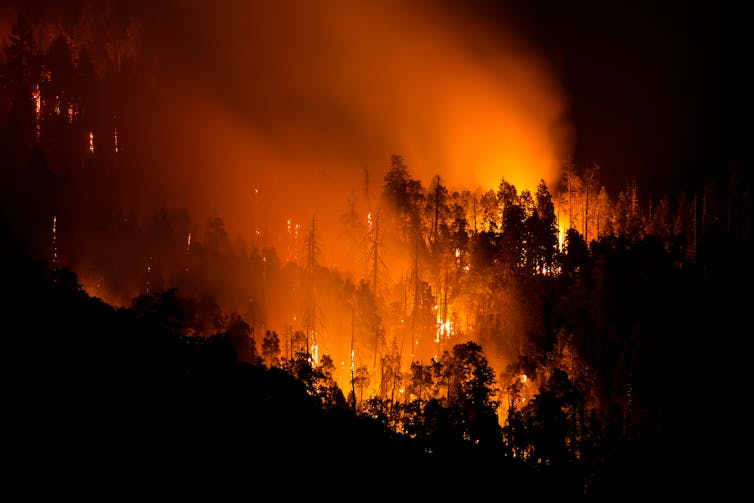
Around the globe, forests are also being harmed by climate change and shifting patterns of wildfires. Climate change is causing more fires, including in forests that do not usually burn, and producing hotter fires which cause long-term damage even in fire-adapted forests. The length and severity of droughts is increasing, inducing water stress which kills trees. A combination of climate-related stresses means that trees in the tropics, temperate and boreal forests, are experiencing dying younger and massive “die offs” are happening more often.
If the effects of fire and climate change continue post-Anthropocene forests are likely to be smaller, simpler in species, emptied of wildlife and restricted to steeper ground where agriculture is less favoured.
Computer simulations of the future climate, known as climate models, depict very different outcomes for forests depending on whether we limit global warming or not. If emissions are reigned in and we leave some cultivated land to nature, 350 million hectares of forest could return by 2100. That’s an area roughly the size of India. However, in a future where emissions remain high and land use doesn’t change, the models suggest a loss of a further 500 million hectares of forest by 2100.
Back On Track
The new Forest Pathways Report I worked on sets out an action plan for getting back on track. It asks global leaders and businesses to:
Accelerate the recognition of Indigenous Peoples and local communities’ right to own and manage their lands, territories and resources.
Provide more money, both public and private, to support sustainable forest economies.
Reform the rules of global trade that harm forests, getting deforesting commodities out of global supply chains, and removing barriers to forest-friendly goods.
Shift towards nature-based and bio economies.
At the next COP28 climate summit in Dubai, there is the promise of bilateral announcements between wealthy donor nations and forested nations in the tropics, as part of the Forest and Climate Leaders’ Partnership signed in Glasgow, two years ago. These packages could support a move towards sustainable forest management and deforestation-free supply chains around the world.
This would be a valuable success, but leadership is desperately needed on other issues such as environmentally harmful subsidies or illegal logging, the financial scale of which both dwarf the funding provided to protect forests.

Don’t have time to read about climate change as much as you’d like?
Get a weekly roundup in your inbox instead. Every Wednesday, The Conversation’s environment editor writes Imagine, a short email that goes a little deeper into just one climate issue. Join the 20,000+ readers who’ve subscribed so far.![]()
Mary Gagen, Professor of Physical Geography, Swansea University
This article is republished from The Conversation under a Creative Commons license. Read the original article.
The wildfires that led to mass extinction: a warning from California’s Ice Age history – podcast
In recent years, Californians have had to deal with some deadly and destructive wildfires. But in fact, this part of the western United States has been shaped by fire for millennia.
In this episode of The Conversation Weekly podcast, we hear about new research from California into a decades-old mystery: the extinction of large animals at the end of the Ice Age. It’s providing some worrying lessons from history about the way humans, fire and ecosystems interact.
In a park in the middle of Los Angeles lies one of the most important fossil sites in the world – the La Brea Tar Pits. The park sits atop a natural oil reserve. Regular earthquakes in the area opened up fissures in the ground, bringing some of that oil to the surface where it sits in pools of tar, or asphalt.
“The asphalt is so sticky that if you were to walk in there, you would not be able to get out without help if you were to get both of your feet stuck. And so that’s what happened over the last part of the Ice Age,” explains Emily Lindsey, a paleoecologist and associate curator at La Brea Tar Pits who also works at the University of California, Los Angeles.
This was a period when large animals roamed the Earth – including, in the area of modern-day California, mammoths, giant ground sloths, sabre-tooth cats and dire wolves. Many of these animals got trapped in the tar pits at La Brea, where their bodies provide a unique fossil record of the animals that moved through the area during the Ice Age – until, that is, about 13,000 years ago, says Lindsey.
What’s unique about the Ice Age is that at the very end of it, after more than 50 million years of having big animals in all global ecosystems, most of those animals went extinct – most of the big ones. And it happened very rapidly.
The cause of this mass extinction has been debated by scientists for decades. In new research, Lindsey and her colleagues decided to use the fossil records at La Brea, combined with sediment records from a nearby lake, to pinpoint exactly when the extinctions took place in California – and what else was happening at the time.
They found that in the 2,000 years leading up to the extinction event, the climate in southern California was warming rapidly, and drying out.
And then 200 years before the extinction event, about 13,200 years ago, we see something very unusual happen. Everything catches on fire.
Lindsey and her team argue that alongside the warming climate, it was humans – whose populations began to expand in this part of North America at around this time – who probably ignited these fires, which eventually led to the extinction of California’s big animals. The findings, she says, are “eerily similar” to what’s happening in the area today.
Listen to The Conversation Weekly podcast for the full interview with Emily Lindsey, plus some insights on the current state of wildfires in North America from Stacy Morford, environment and climate editor at The Conversation in the US. A full transcript will be available soon.
This episode was written and produced by Katie Flood. Eloise Stevens does our sound design, and our theme music is by Neeta Sarl. Gemma Ware is the executive producer of the show.
Newsclips in this episode are from CBS Evening News and NBC News.
You can find us on X, formerly known as Twitter @TC_Audio, on Instagram at theconversationdotcom or via email. You can also subscribe to The Conversation’s free daily email here.
Listen to The Conversation Weekly via any of the apps listed above, download it directly via our RSS feed or find out how else to listen here.![]()
Gemma Ware, Editor and Co-Host, The Conversation Weekly Podcast, The Conversation
This article is republished from The Conversation under a Creative Commons license. Read the original article.
Why Storm Ciarán’s winds were so strong
Suzanne Gray, University of Reading and Ambrogio Volonté, University of ReadingStorm Ciarán made landfall in southern regions of the UK during the evening of November 1, 2023. The UK’s Met Office issued amber weather warnings for November 2 in specific areas in the south of the UK, cautioning about high winds. This amber alert represents the second-highest level in the Met Office’s three-tier system.
Yellow warnings were also in place for both wind and rain, extending over a broader area and timeframe.
Ciarán unleashed extremely strong and destructive winds in some areas. Gusts of up to 102 mph were recorded in Jersey, and there have been reports of an 128 mph wind gust in Brittany on France’s north-west coast. For comparison, the record wind gust in England stands at 122 mph, set in 2022.
But why were Storm Ciarán’s winds so strong? The explanation lies in the fact that Ciarán was not your typical extratropical cyclone (or windstorm); it was an explosively developing one.
An Explosive Cyclone
One notable characteristic of Storm Ciarán was the extreme depth of its low-pressure centre. The UK Met Office announced that the central surface pressure, when adjusted to the mean sea level value, dropped to 953.3 millibars (mb) – a new record for England and Wales in the month of November.
The rate at which Ciarán’s pressure dropped was also exceptional. In fact, it far exceeded the threshold of approximately 24 mb in 24 hours (with a slight adjustment based on latitude) required to classify a storm as an explosively deepening cyclone “bomb”.
This rapid intensification occurred as Ciarán, initially fuelled by the ascent and condensation of air over warm waters, found itself positioned beneath the front-left side of a particularly intense jet stream. The jet stream, characterised by high winds approximately 6 miles above the Earth’s surface, reached speeds of up to 200 mph on November 1, making it an especially favourable environment for a storm to intensify in.
Why Is This Important?
One of the primary factors influencing the intensity of surface winds in a storm like Ciarán is the rate of change in surface pressure. On weather charts, you’ll often encounter lines of constant surface pressure, known as isobars. When isobars are closely spaced, they indicate the presence of strong winds.
To illustrate this concept, picture two columns of water, one deeper than the other. If these columns are connected near their bottom ends, water will naturally flow from the deeper column to the shallower one, resulting in a stronger flow when there’s a significant difference in water depth. Similarly, air in our atmosphere tends to move from areas of higher pressure to lower pressure. The greater the difference in pressure, the stronger the associated winds.
Because the Earth is rotating, these winds turn towards the right and generally follow the direction of the isobars rather than being directed towards the low pressure. Bomb cyclones obtain deep low-pressure centres, and the isobars are most tightly packed in the south-west quadrant of the storm, resulting in the strongest “gradient” winds in that region.
In Ciarán’s case, this arc-shaped north-eastward travelling region covered Brittany, the Channel Islands, the far south-west of England and eventually the country’s far south-east.
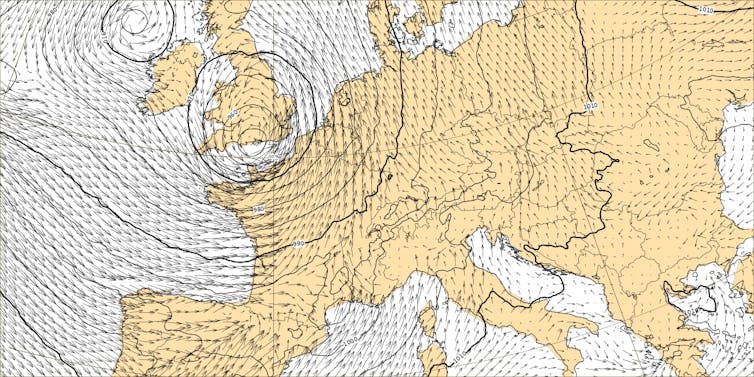
Often, these storms also move rapidly. Fast travel speed further contributes to the strength of the surface winds. This was the case for Ciarán, which crossed the North Atlantic in just a couple of days.
Did Ciarán Have A Sting Jet?
During some intense windstorms, there can be an additional airstream known as the “sting jet”. Sting jets originate from specific cloud regions within the cyclone and can generate brief (lasting a few hours) and relatively small (60 miles across) areas of extremely strong winds, which are accompanied by very intense gusts should they reach the ground.
Storms containing sting jets have a distinctive structure, often characterised by rapidly deepening clouds. The evolution of Storm Ciarán was consistent with that structure.
Satellite images before the storm hit revealed narrow bands at the tip of the cloud hooking round the storm centre, the region from which the sting jet descends. However, detailed analysis will be required after the event to confirm whether sting jets were present.
Sting jets do have the potential to worsen the damage caused by storms. But it’s important to note that Ciarán was forecast to unleash strong winds even in the absence of a sting jet.
As a point of reference, Storm Eunice, which gained notoriety in February 2022 for prompting the first ever Met Office red warning for wind in southern England, setting England’s current wind gust record, and damaging the roof of London’s O2 arena, featured a sting jet.
However, by the time the storm arrived London, it had reached a mature stage. And our own research suggests that the damaging winds were the result of a combination of several different airstreams, including a sting jet.
In explosively developing cyclones such as Storm Ciarán, damaging winds can be caused by a number of different airstreams that include, but are not limited to, sting jets.

Don’t have time to read about climate change as much as you’d like?
Get a weekly roundup in your inbox instead. Every Wednesday, The Conversation’s environment editor writes Imagine, a short email that goes a little deeper into just one climate issue. Join the 20,000+ readers who’ve subscribed so far.![]()
Suzanne Gray, Professor of Meteorology, University of Reading and Ambrogio Volonté, Senior Research Fellow, University of Reading
This article is republished from The Conversation under a Creative Commons license. Read the original article.
When science showed in the 1970s that gas stoves produced harmful indoor air pollution, the industry reached for tobacco’s PR playbook

In 1976, beloved chef, cookbook author and television personality Julia Child returned to WGBH-TV’s studios in Boston for a new cooking show, “Julia Child & Company,” following her hit series “The French Chef.” Viewers probably didn’t know that Child’s new and improved kitchen studio, outfitted with gas stoves, was paid for by the American Gas Association.
While this may seem like any corporate sponsorship, we now know it was a part of a calculated campaign by gas industry executives to increase use of gas stoves across the United States. And stoves weren’t the only objective. The gas industry wanted to grow its residential market, and homes that used gas for cooking were likely also to use it for heat and hot water.
The industry’s efforts went well beyond careful product placement, according to new research from the nonprofit Climate Investigations Center, which analyzes corporate efforts to undermine climate science and slow the ongoing transition away from fossil fuels. As the center’s study and a National Public Radio investigation show, when evidence emerged in the early 1970s about the health effects of indoor nitrogen dioxide exposure from gas stove use, the American Gas Association launched a campaign designed to manufacture doubt about the existing science.
As a researcher who has studied air pollution for many years – including gas stoves’ contribution to indoor air pollution and health effects – I am not naïve about the strategies that some industries use to avoid or delay regulations. But I was surprised to learn that the multipronged strategy related to gas stoves directly mirrored tactics that the tobacco industry used to undermine and distort scientific evidence of health risks associated with smoking starting in the 1950s.
Manufacturing Controversy
The gas industry relied on Hill & Knowlton, the same public relations company that masterminded the tobacco industry’s playbook for responding to research linking smoking to lung cancer. Hill & Knowlton’s tactics included sponsoring research that would counter findings about gas stoves published in the scientific literature, emphasizing uncertainty in these findings to construct artificial controversy and engaging in aggressive public relations efforts.
For example, the gas industry obtained and reanalyzed the data from an EPA study on Long Island that showed more respiratory problems in homes with gas stoves. Their reanalysis concluded that there were no significant differences in respiratory outcomes.
The industry also funded its own health studies in the early 1970s, which confirmed large differences in nitrogen dioxide exposures but did not show significant differences in respiratory outcomes. These findings were documented in publications where industry funding was not disclosed. These conclusions were amplified in numerous meetings and conferences and ultimately influenced major governmental reports summarizing the state of the literature.
This campaign was remarkable, since the basics of how gas stoves affected indoor air pollution and respiratory health were straightforward and well established at the time. Burning fuel, including natural gas, generates nitrogen oxides: The air in Earth’s atmosphere is about 78% nitrogen and 21% oxygen, and these gases react at high temperatures.
Nitrogen dioxide is known to adversely affect respiratory health. Inhaling it causes respiratory irritation and can worsen diseases such as asthma. This is a key reason why the U.S. Environmental Protection Agency established an outdoor air quality standard for nitrogen dioxide in 1971.
No such standards exist for indoor air, but as the EPA now acknowledges, nitrogen dioxide exposure indoors also is harmful.

How Harmful Is Indoor Exposure?
The key question is whether nitrogen dioxide exposure related to gas stoves is large enough to lead to health concerns. While levels vary across homes, scientific research shows that the simple answer is yes – especially in smaller homes and when ventilation is inadequate.
This has been known for a long time. For example, a 1998 study that I co-authored showed that the presence of gas stoves was the strongest predictor of personal exposure to nitrogen dioxide. And work dating back to the 1970s showed that indoor nitrogen dioxide levels in the presence of gas stoves could be far higher than outdoor levels. Depending on ventilation levels, concentrations could reach levels known to contribute to health risks.
Despite this evidence, the gas industry’s campaign was largely successful. Industry-funded studies successfully muddied the waters, as I have seen over the course of my research career, and stalled further federal investigations or regulations addressing gas stove safety.
This issue took on new life at the end of 2022, when researchers published a new study estimating that 12.7% of U.S. cases of childhood asthma – about one case in eight – were attributable to gas stoves. The industry continues to cast doubt on gas stoves’ contribution to health effects and fund pro-gas stove media campaigns.
A Concern For Climate And Health
Residential gas use is also controversial today because it slows the ongoing shift toward renewable energy, at a time when the impacts of climate change are becoming alarmingly clear. Some cities have already moved or are considering steps to ban gas stoves in new construction and shift toward electrifying buildings.
As communities wrestle with these questions, regulators, politicians and consumers need accurate information about the risks of gas stoves and other products in homes. There is room for vigorous debate that considers a range of evidence, but I believe that everyone has a right to know where that evidence comes from.
The commercial interests of many industries, including alcohol, tobacco and fossil fuels, aren’t always compatible with the public interest or human health. In my view, exposing the tactics that vested interests use to manipulate the public can make consumers and regulators savvier and help deter other industries from using their playbook.![]()
Jonathan Levy, Professor and Chair, Department of Environmental Health, Boston University
This article is republished from The Conversation under a Creative Commons license. Read the original article.
Billions of birds collide with glass buildings – but architecture has solutions

At least 1,000 birds were killed in one day in early October, when they collided with a single Chicago building, McCormick Place Lakeside Center – the largest convention centre in North America. A paradigm of architectural modernism, the Lakeside Centre was built in stages from 1960 to 2017, and is a steel, concrete and glass behemoth.
Although not particularly tall by contemporary standards, the building’s almost unbroken glass facade presents a problem for birds, most notably at night when the brilliantly lit interiors cause them to become confused. The thousand killed that day were a small proportion of the millions of migratory birds that were moving southwards across the continent to their wintering grounds – a journey undertaken twice yearly by these animals.
What makes this mass bird death unusual isn’t the number of animals that died (the American Bird Conservancy estimates that up to a billion birds suffer the same fate every year), but that it garnered so much public attention. This was thanks to the Chicago Bird Collision Monitors, a volunteer group that has recorded bird strikes in the city since 2003. According to their records, this was the largest number of dead birds recorded in the grounds of one building over a single day.
One way to prevent bird strikes is to pay more attention to the design of glass buildings in cities. Chicago set an example for this in 2009, when US architect Jeanne Gang’s Aqua Tower was completed. Its wave-like facade and fritted glass were in part designed to stop birds flying into the building’s windows. Fritted glass is printed with ink and contains ultra-small particles of ground-up glass, giving it a frosted or otherwise slightly opaque appearance.
This was just one aspect of Gang’s effort to “naturalise” the skyscraper – buildings that are typically composed of straight lines on account of their steel or concrete frames. As the Catalan architect Antoni Gaudí once quipped: “There are no straight lines or sharp corners in nature.”
Bird-Safe Glass
The Aqua Tower has curved balconies to soften the hard edges of what is an otherwise conventional skyscraper. The wave-like rippling effect also serves to minimise wind shear and create shade. In tandem with the fritted glass, the reflective qualities and hard edges of the glass are dampened, helping to prevent confusion, particularly at night.

The tower demonstrates how architectural features usually chosen to enhance human lives can also benefit other organisms. This challenge was taken up by Buffalo-based architect Joyce Hwang in her project No Crash Zone from 2015. Hwang temporarily applied patterns to the windows of the Sullivan Center in Chicago, ostensibly to deter birds from flying into the glass, but also to add aesthetic interest to the material itself.
Hwang has argued that architects can still use glass in buildings – but with a little imagination, they can incorporate graphic ornamentation that will please us as well as other creatures (or maybe just not distract them).
More easily applied design solutions include bird-friendly film: a laminate of dots applied to glass to help birds see windows as objects rather than transparent, which minimises the risk of collision. This feature has been adopted by Columbia University in New York and several other buildings in the city, including a hotel, cemetery, mail facility and ferry terminal.

Lights Out
The way humans make use of artificial light, it seems, is the more intractable problem when it comes to caring for birds.
In 2019, it was discovered that the annual Tribute in Light installation, held in New York City every year to mark the anniversary of the 9/11 attacks, caused migratory birds to become disorientated and exhausted. The birds are drawn to the four-mile high beams of light, veering off their migratory routes and becoming trapped by the spectacle.
In 2020, the decision was made to periodically switch off the lights and then restart them so that, even if the birds become disorientated, they can recover and continue on their way.
A 2021 study carried out in Chicago demonstrated the wider application of this principle: by shutting off half the lights in larger buildings at night, bird collisions can be reduced by anything from six- to 11-fold. At the time of writing, a change in the law is being debated in New York to prohibit nighttime illumination of unoccupied buildings. Many courtrooms, libraries and public schools in the city already turn off their lights during the bird migration season.
Whether these changes can spur a wider transformation of attitudes towards artificial light in cities is uncertain. After all, nighttime illumination is bound up with the 24/7 culture of cities, which has seen the natural cycles of light and dark long since banished. Today, the illuminated city only goes dark in extreme circumstances, like the widespread power failures across New York City that followed Hurricane Sandy in October 2012.
Yet people could choose other ways to use less artificial light. Darkness is a vital part of nature. It is the means by which animals, and plants, rest and take cover. For migratory birds, darkness is a safe place; it also allows them to perceive the world as they need to, with the light of the Moon and stars (and their sensitivity to the Earth’s magnetic field) guiding their long journeys.
Care for migratory birds could also yield a greater appreciation of dark skies. Making nighttime cities more bird-friendly might help human residents reconnect with the beauty and awe that these vistas inspire.

Don’t have time to read about climate change as much as you’d like?
Get a weekly roundup in your inbox instead. Every Wednesday, The Conversation’s environment editor writes Imagine, a short email that goes a little deeper into just one climate issue. Join the 20,000+ readers who’ve subscribed so far.![]()
Paul Dobraszczyk, Lecturer in Architecture, UCL
This article is republished from The Conversation under a Creative Commons license. Read the original article.
Pittwater Reserves: Histories + Notes + Pictorial Walks
A History Of The Campaign For Preservation Of The Warriewood Escarpment by David Palmer OAM and Angus Gordon OAM
A Stroll Around Manly Dam: Spring 2023 by Kevin Murray and Joe Mills
A Stroll Through Warriewood Wetlands by Joe Mills February 2023
A Walk Around The Cromer Side Of Narrabeen Lake by Joe Mills
America Bay Track Walk - photos by Joe Mills
An Aquatic June: North Narrabeen - Turimetta - Collaroy photos by Joe Mills
Angophora Reserve Angophora Reserve Flowers Grand Old Tree Of Angophora Reserve Falls Back To The Earth - History page
Annie Wyatt Reserve - A Pictorial
Aquatic Reflections seen this week (May 2023): Narrabeen + Turimetta by Joe Mills
Avalon's Village Green: Avalon Park Becomes Dunbar Park - Some History + Toongari Reserve and Catalpa Reserve
Bairne Walking Track Ku-Ring-Gai Chase NP by Kevin Murray
Bangalley Headland Bangalley Mid Winter
Bangalley Headland Walk: Spring 2023 by Kevin Murray and Joe Mills
Banksias of Pittwater
Barrenjoey Boathouse In Governor Phillip Park Part Of Our Community For 75 Years: Photos From The Collection Of Russell Walton, Son Of Victor Walton
Barrenjoey Headland: Spring flowers
Barrenjoey Headland after fire
Bayview Baths
Bayview Wetlands
Beeby Park
Bilgola Beach
Botham Beach by Barbara Davies
Bungan Beach Bush Care
Careel Bay Saltmarsh plants
Careel Bay Birds
Careel Bay Clean Up day
Careel Bay Playing Fields History and Current
Careel Creek
Careel Creek - If you rebuild it they will come
Centre trail in Ku-ring-gai Chase National Park
Chiltern Track- Ingleside by Marita Macrae
Clareville Beach
Clareville/Long Beach Reserve + some History
Coastal Stability Series: Cabbage Tree Bay To Barrenjoey To Observation Point by John Illingsworth, Pittwater Pathways, and Dr. Peter Mitchell OAM
Cowan Track by Kevin Murray
Curl Curl To Freshwater Walk: October 2021 by Kevin Murray and Joe Mills
Currawong and Palm Beach Views - Winter 2018
Currawong-Mackerel-The Basin A Stroll In Early November 2021 - photos by Selena Griffith
Currawong State Park Currawong Beach + Currawong Creek
Deep Creek To Warriewood Walk photos by Joe Mills
Drone Gives A New View On Coastal Stability; Bungan: Bungan Headland To Newport Beach + Bilgola: North Newport Beach To Avalon + Bangalley: Avalon Headland To Palm Beach
Duck Holes: McCarrs Creek by Joe Mills
Dunbar Park - Some History + Toongari Reserve and Catalpa Reserve
Dundundra Falls Reserve: August 2020 photos by Selena Griffith - Listed in 1935
Elsie Track, Scotland Island
Elvina Track in Late Winter 2019 by Penny Gleen
Elvina Bay Walking Track: Spring 2020 photos by Joe Mills
Elvina Bay-Lovett Bay Loop Spring 2020 by Kevin Murray and Joe Mills
Fern Creek - Ingleside Escarpment To Warriewood Walk + Some History photos by Joe Mills
Iluka Park, Woorak Park, Pittwater Park, Sand Point Reserve, Snapperman Beach Reserve - Palm Beach: Some History
Ingleside
Ingleside Wildflowers August 2013
Irrawong - Ingleside Escarpment Trail Walk Spring 2020 photos by Joe Mills
Irrawong - Mullet Creek Restoration
Katandra Bushland Sanctuary - Ingleside
Lucinda Park, Palm Beach: Some History + 2022 Pictures
McCarrs Creek
McCarr's Creek to Church Point to Bayview Waterfront Path
McKay Reserve
Mona Vale Beach - A Stroll Along, Spring 2021 by Kevin Murray
Mona Vale Headland, Basin and Beach Restoration
Mona Vale Woolworths Front Entrance Gets Garden Upgrade: A Few Notes On The Site's History
Mount Murray Anderson Walking Track by Kevin Murray and Joe Mills
Mullet Creek
Narrabeen Creek
Narrabeen Lagoon Catchment: Past Notes Present Photos by Margaret Woods
Narrabeen Lagoon Entrance Clearing Works: September To October 2023 pictures by Joe Mills
Narrabeen Lagoon State Park
Narrabeen Lagoon State Park Expansion
Narrabeen Rockshelf Aquatic Reserve
Nerang Track, Terrey Hills by Bea Pierce
Newport Bushlink - the Crown of the Hill Linked Reserves
Newport Community Garden - Woolcott Reserve
Newport to Bilgola Bushlink 'From The Crown To The Sea' Paths: Founded In 1956 - A Tip and Quarry Becomes Green Space For People and Wildlife
Pittwater Reserves: The Green Ways; Bungan Beach and Bungan Head Reserves: A Headland Garden
Pittwater Reserves, The Green Ways: Clareville Wharf and Taylor's Point Jetty
Pittwater Reserves: The Green Ways; Hordern, Wilshire Parks, McKay Reserve: From Beach to Estuary
Pittwater Reserves - The Green Ways: Mona Vale's Village Greens a Map of the Historic Crown Lands Ethos Realised in The Village, Kitchener and Beeby Parks
Pittwater Reserves: The Green Ways Bilgola Beach - The Cabbage Tree Gardens and Camping Grounds - Includes Bilgola - The Story Of A Politician, A Pilot and An Epicure by Tony Dawson and Anne Spencer
Pittwater spring: waterbirds return to Wetlands
Pittwater's Lone Rangers - 120 Years of Ku-Ring-Gai Chase and the Men of Flowers Inspired by Eccleston Du Faur
Pittwater's Great Outdoors: Spotted To The North, South, East + West- June 2023: Palm Beach Boat House rebuild going well - First day of Winter Rainbow over Turimetta - what's Blooming in the bush? + more by Joe Mills, Selena Griffith and Pittwater Online
Pittwater's Parallel Estuary - The Cowan 'Creek
Resolute Track at West Head by Kevin Murray
Resolute Track Stroll by Joe Mills
Riddle Reserve, Bayview
Salvation Loop Trail, Ku-Ring-Gai Chase National Park- Spring 2020 - by Selena Griffith
Seagull Pair At Turimetta Beach: Spring Is In The Air!
Stapleton Reserve
Stapleton Park Reserve In Spring 2020: An Urban Ark Of Plants Found Nowhere Else
Stony Range Regional Botanical Garden: Some History On How A Reserve Became An Australian Plant Park
The Chiltern Track
The Chiltern Trail On The Verge Of Spring 2023 by Kevin Murray and Joe Mills
The Resolute Beach Loop Track At West Head In Ku-Ring-Gai Chase National Park by Kevin Murray
Topham Track Ku-Ring-Gai Chase NP, August 2022 by Joe Mills and Kevin Murray
Towlers Bay Walking Track by Joe Mills
Trafalgar Square, Newport: A 'Commons' Park Dedicated By Private Landholders - The Green Heart Of This Community
Tranquil Turimetta Beach, April 2022 by Joe Mills
Turimetta Beach Reserve by Joe Mills, Bea Pierce and Lesley
Turimetta Beach Reserve: Old & New Images (by Kevin Murray) + Some History
Turimetta Headland
Turimetta Moods by Joe Mills: June 2023
Turimetta Moods (Week Ending June 23 2023) by Joe Mills
Turimetta Moods: June To July 2023 Pictures by Joe Mills
Turimetta Moods: July Becomes August 2023 by Joe Mills
Turimetta Moods: August Becomes September 2023 ; North Narrabeen - Turimetta - Warriewood - Mona Vale photographs by Joe Mills
Turimetta Moods: Mid-September To Mid-October 2023 by Joe Mills
Warriewood Wetlands - Creeks Deteriorating: How To Report Construction Site Breaches, Weed Infestations + The Long Campaign To Save The Warriewood Wetlands & Ingleside Escarpment March 2023
Warriewood Wetlands and Irrawong Reserve
Whale Beach Ocean Reserve: 'The Strand' - Some History On Another Great Protected Pittwater Reserve
Wilshire Park Palm Beach: Some History + Photos From May 2022
Winji Jimmi - Water Maze

Manly Junior Class NSW - Round 1 Regatta
- Round 1 will be hosted by Royal Prince Alfred Yacht Club (RPAYC) on 25 & 26 November 2023.
- Round 2 will be hosted by Hornsby Ku-ring-gai Sailing Club (HKSC) on 10 & 11 February 2024.

Australian Flowers: Impromptu For The Piano Forte / By Miska Hauser. From The Australian Album, 1857

‘They are all new–all colonial. Here–in this city–they were played, printed, and published. True, some of the composers are foreigners; but still this book is as much an Australian production as a cluster of grapes from the German vineyards at Kissing Point. We can send the work home as a specimen of what we can do out here at Botany Bay – as an index of our education, refinement, art-feeling.' - Frank Fowler, preface to the ‘Australian Album’, Sydney: Clarke, 1857.
History For You: Bilgola Beach Rockpool Safety Works In October 1968
Do you go swimming at Bilgola Pool with the Avalon Bilgola Swimming Club or just for fun?
Then this may interest you!
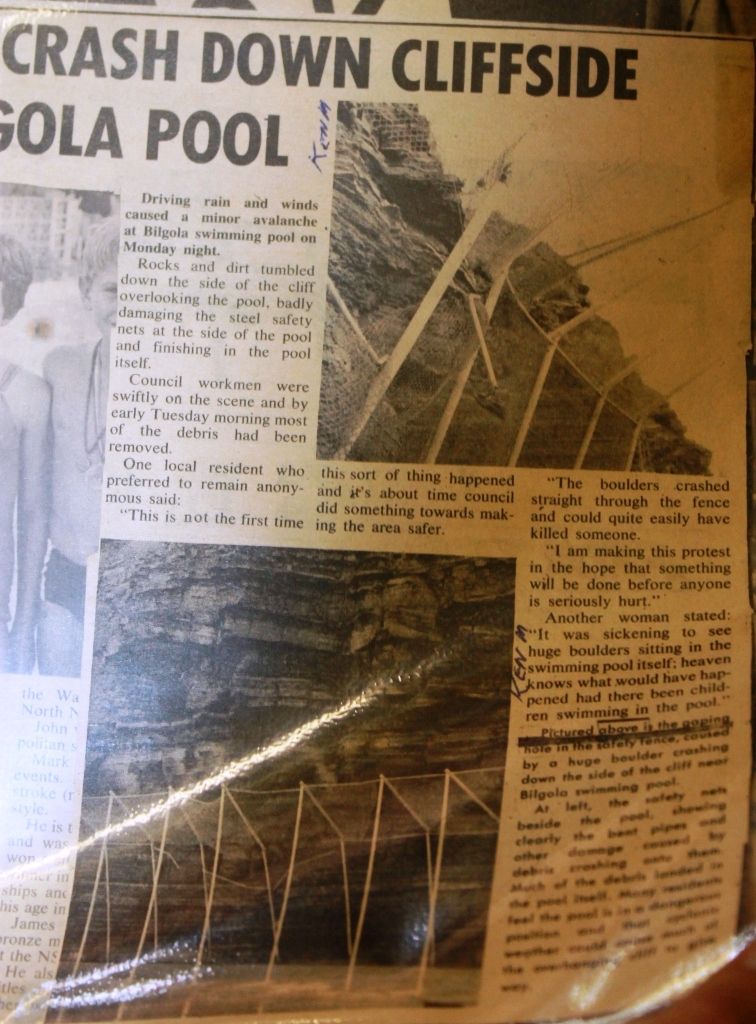


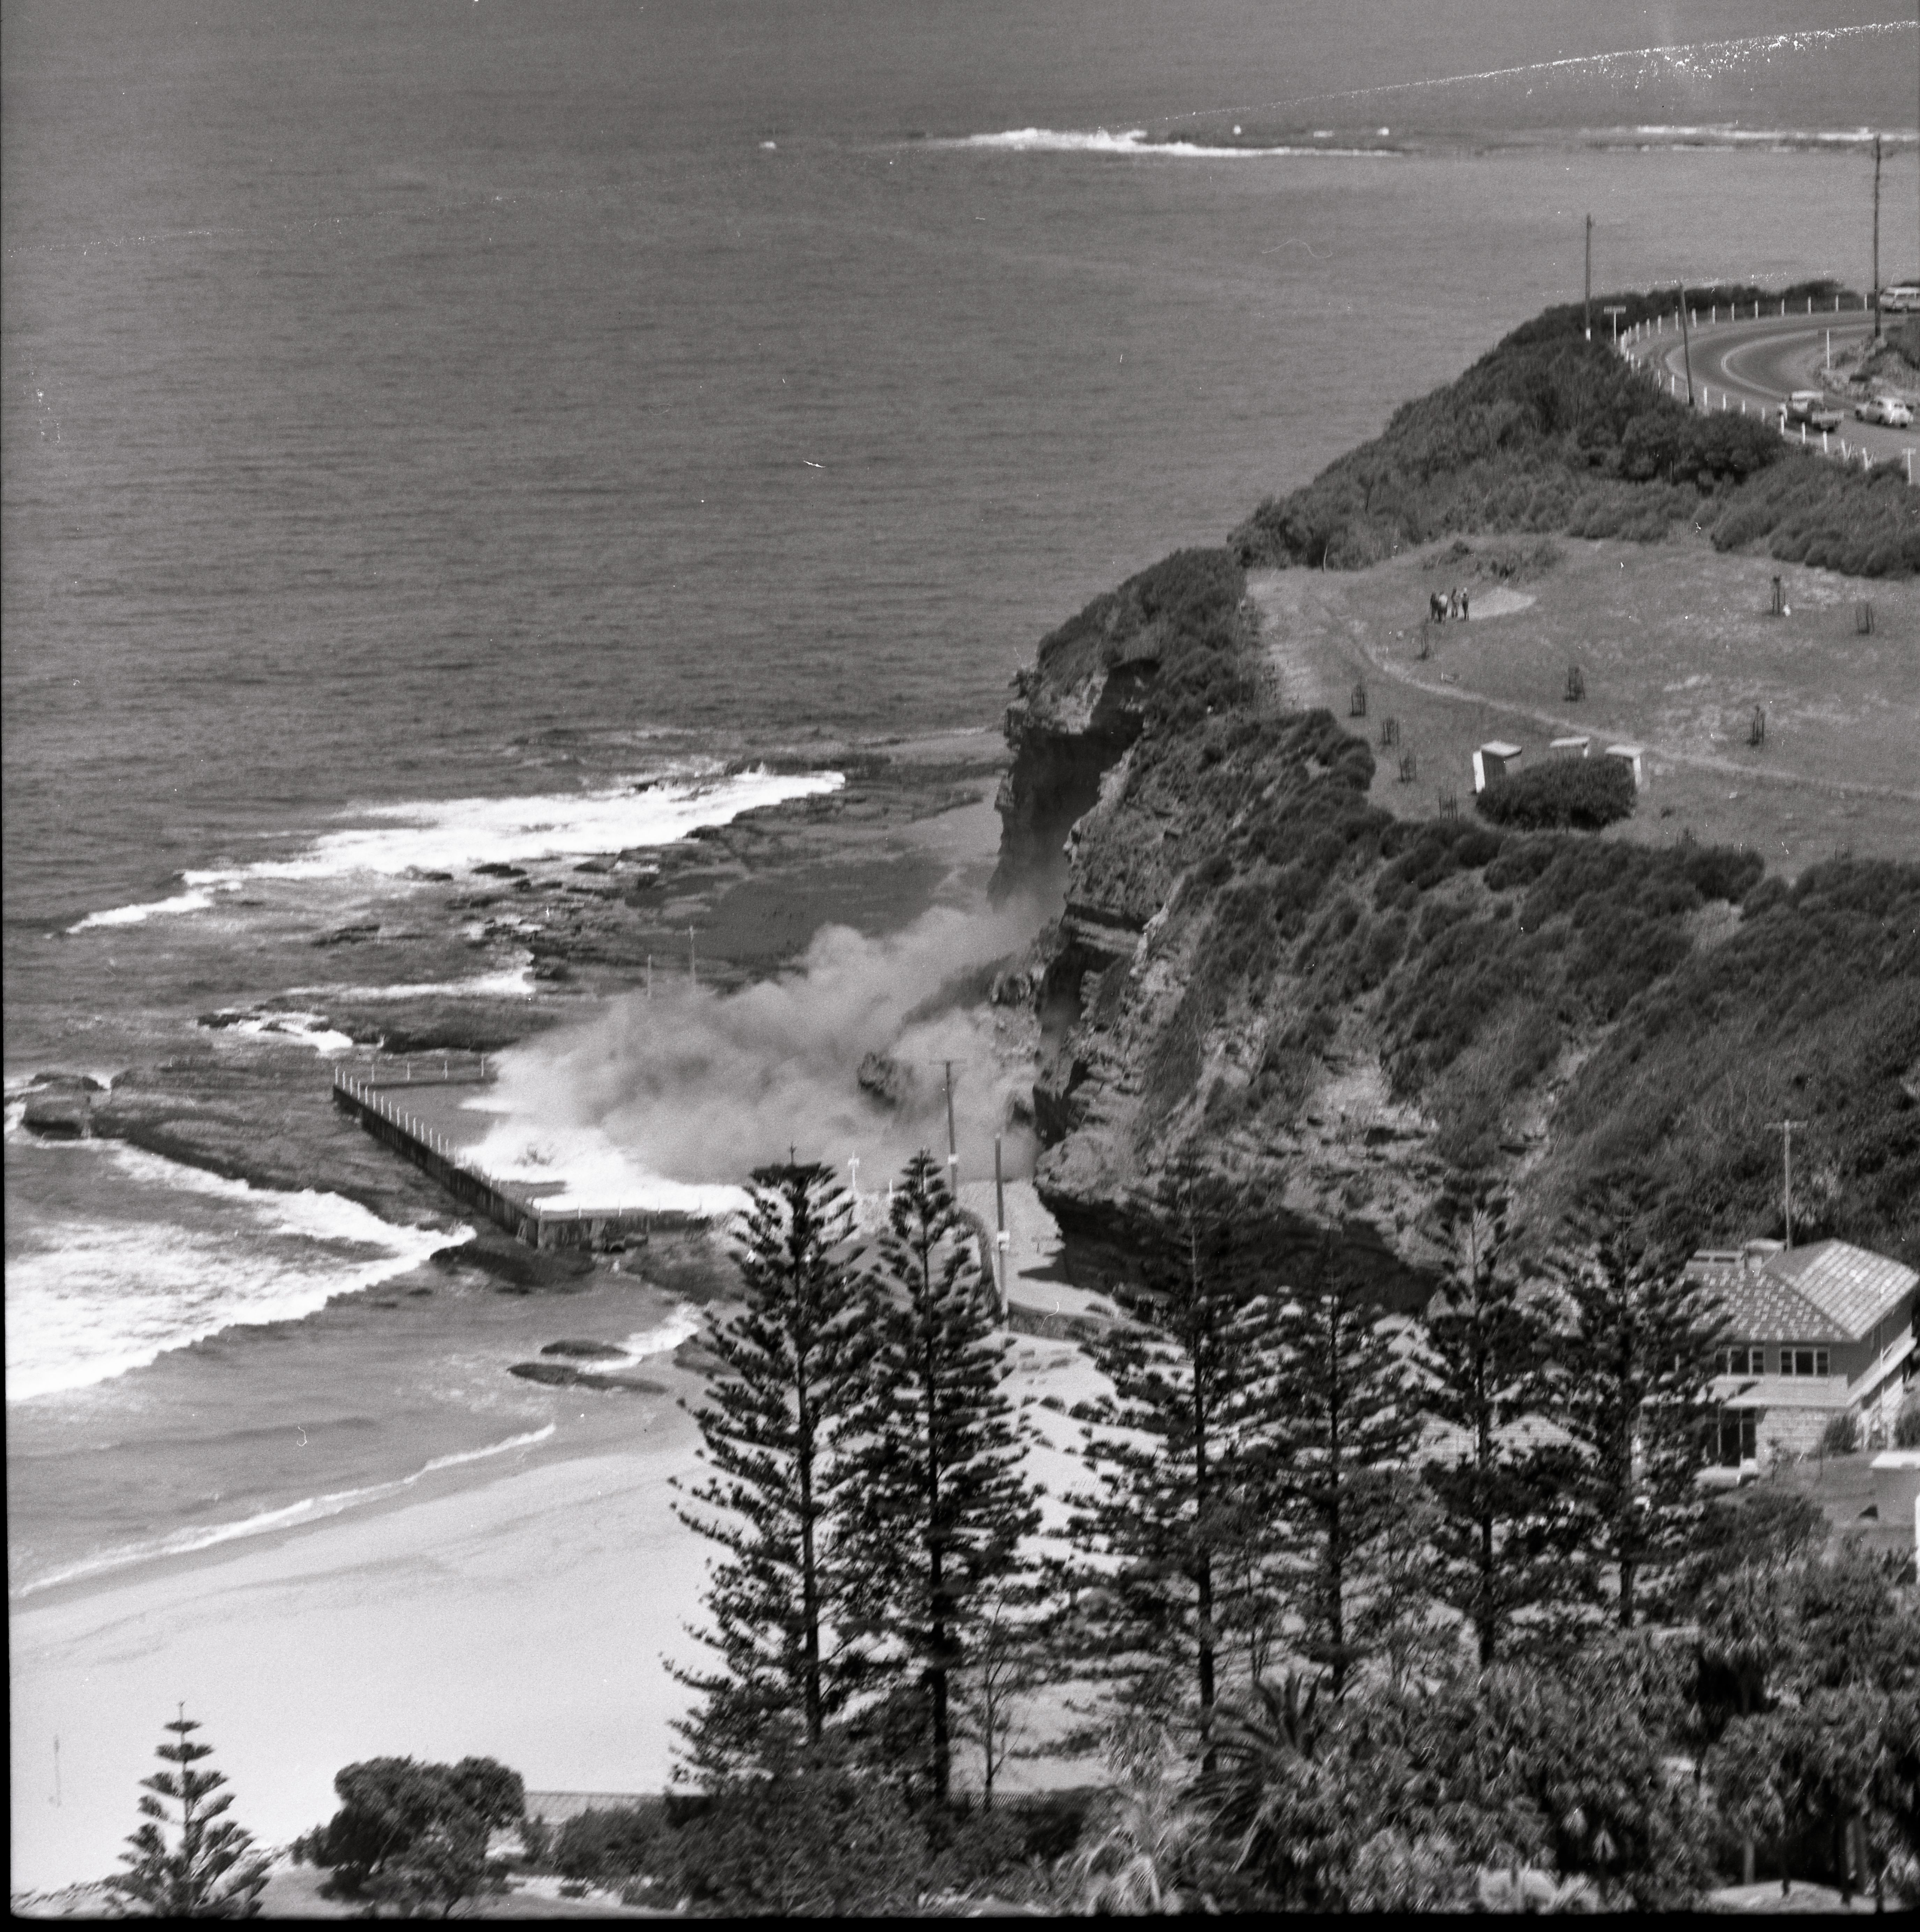

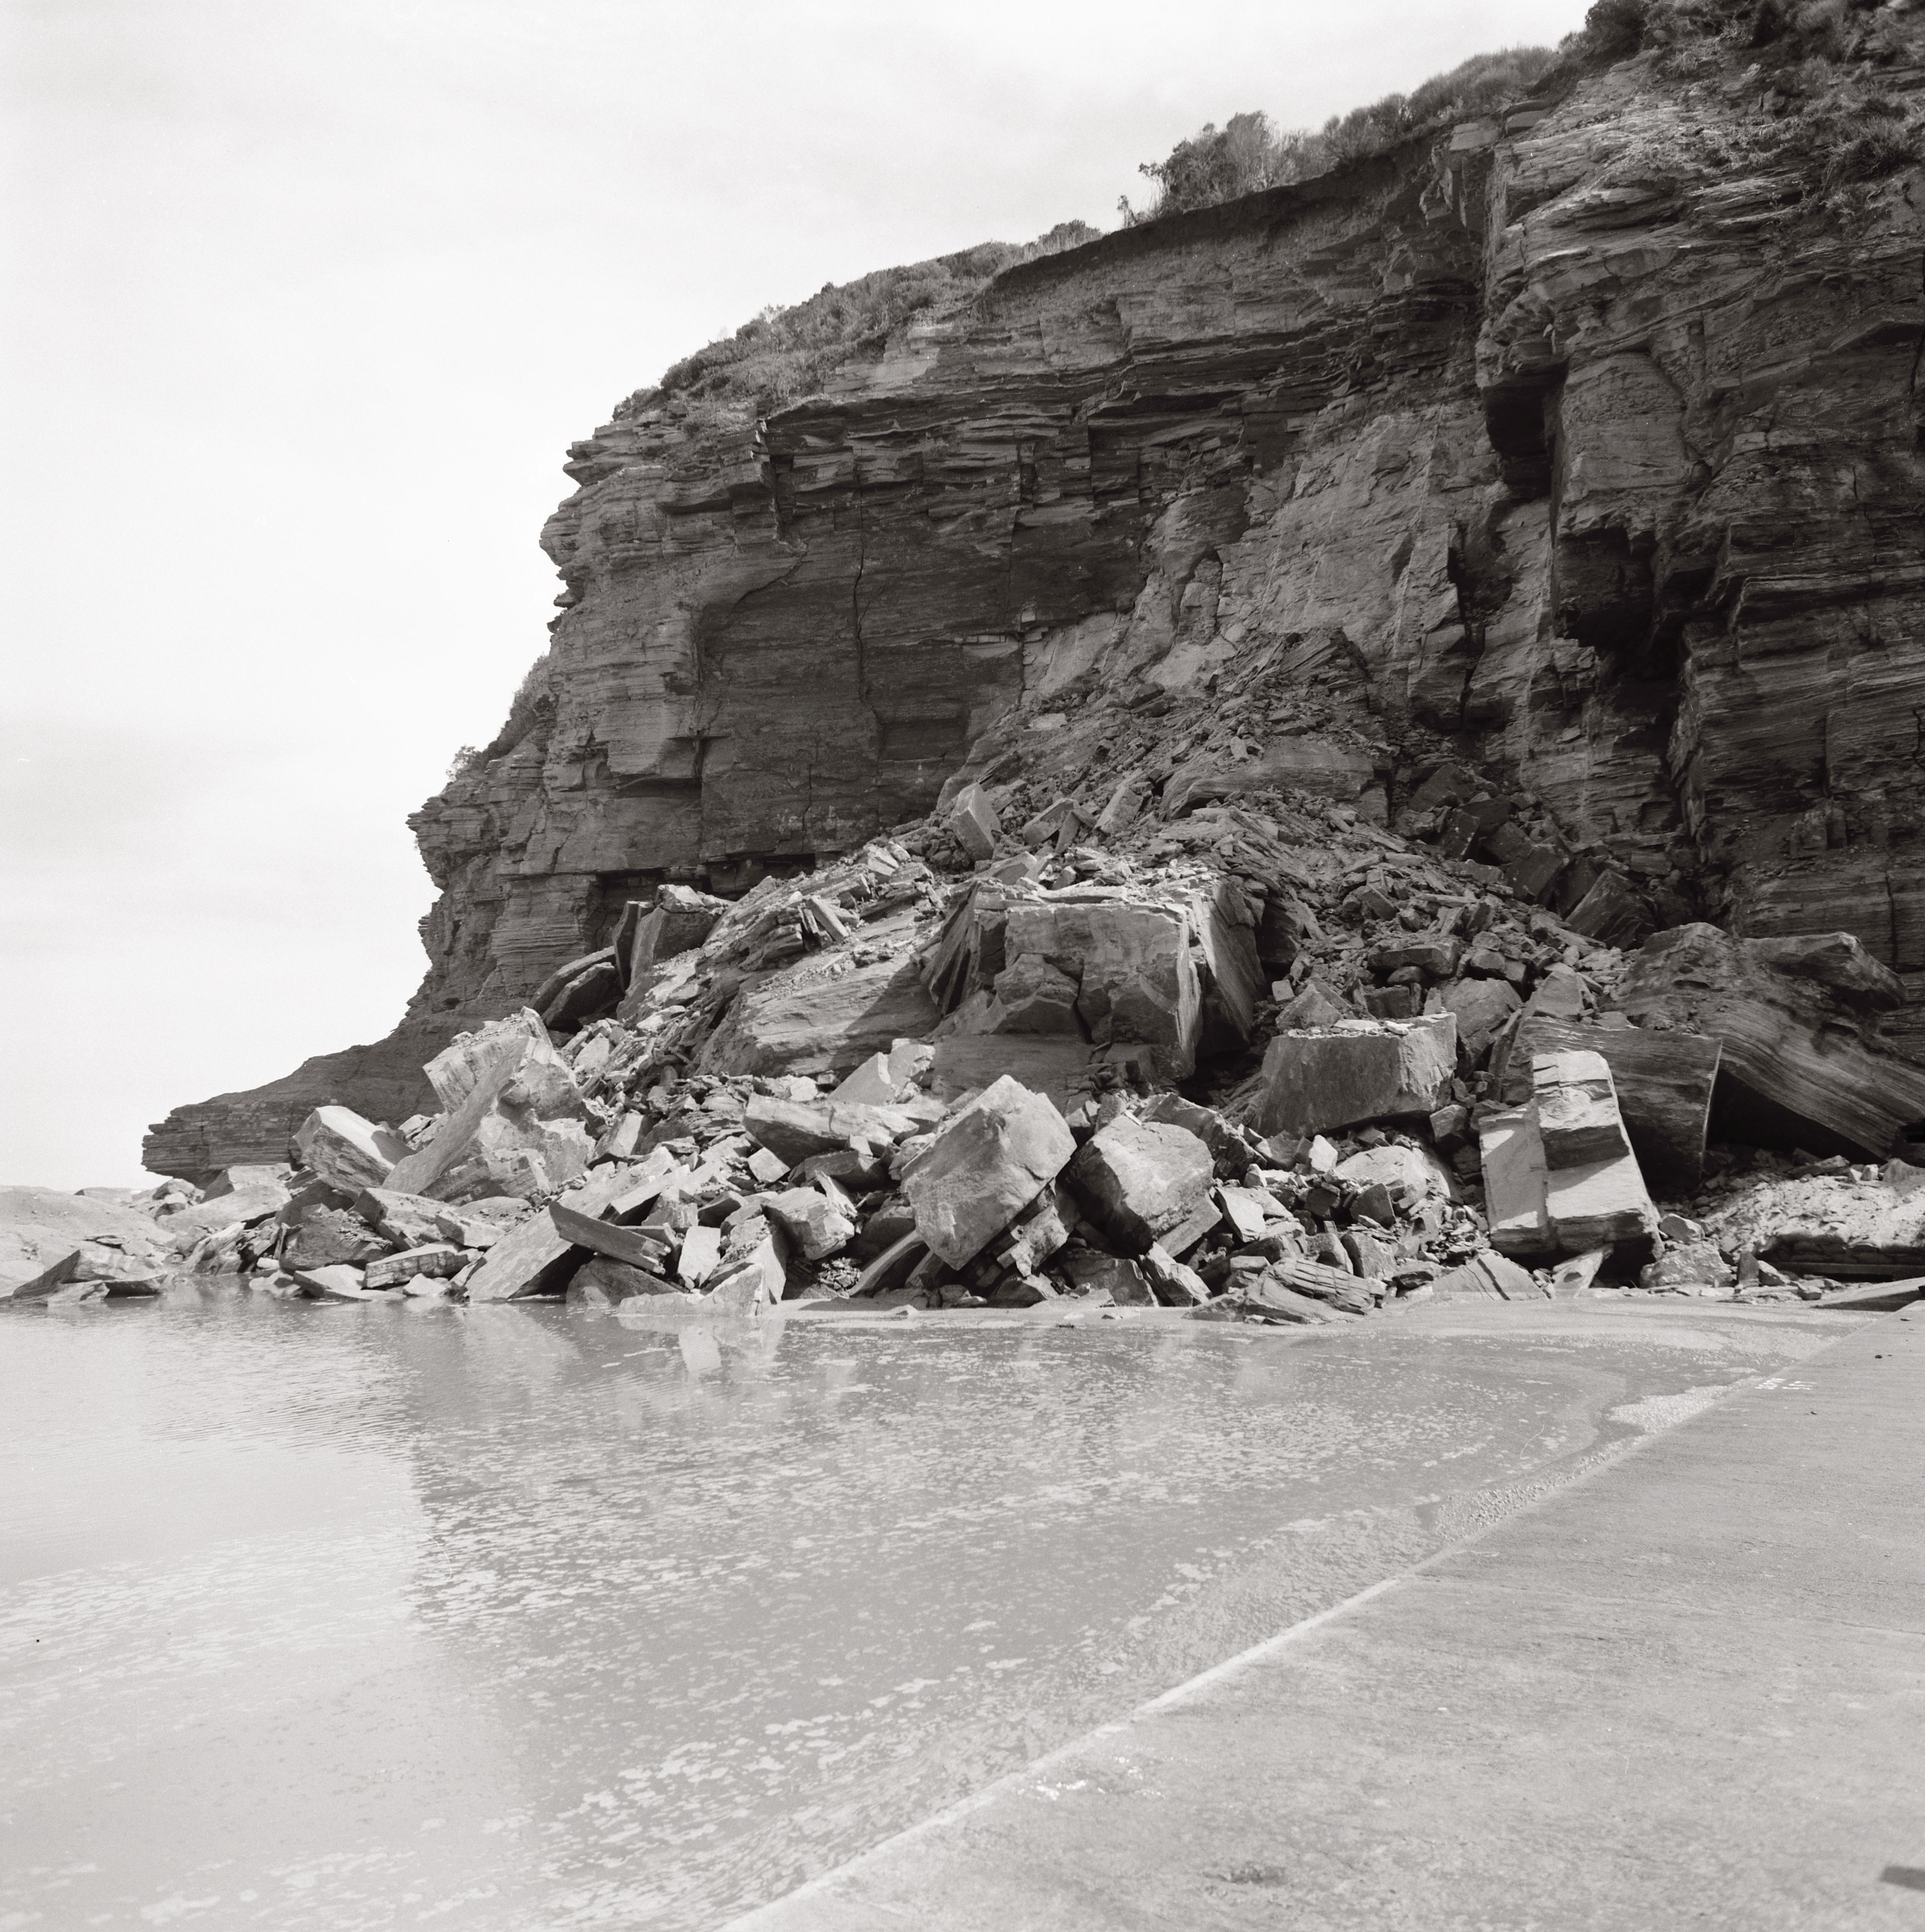

Well Done HSC Class Of 2023!

Warning: Multiple Types Of High-Dose MDMA Tablets (Ecstasy) Circulating In NSW
- blue diamond shaped tablet with ‘punisher’ logo contained 216 mg MDMA
- blue skull shaped tablet with ‘MYBRAND’ logo and text contained 216 mg MDMA
- yellow square tablet with ‘SpongeBob’ smiley face markings contained 160 mg MDMA.


TEDxSydney Youth 2023
School Leavers Support
- Download or explore the SLIK here to help guide Your Career.
- School Leavers Information Kit (PDF 5.2MB).
- School Leavers Information Kit (DOCX 0.9MB).
- The SLIK has also been translated into additional languages.
- Download our information booklets if you are rural, regional and remote, Aboriginal or Torres Strait Islander, or living with disability.
- Support for Regional, Rural and Remote School Leavers (PDF 2MB).
- Support for Regional, Rural and Remote School Leavers (DOCX 0.9MB).
- Support for Aboriginal and/or Torres Strait Islander School Leavers (PDF 2MB).
- Support for Aboriginal and/or Torres Strait Islander School Leavers (DOCX 1.1MB).
- Support for School Leavers with Disability (PDF 2MB).
- Support for School Leavers with Disability (DOCX 0.9MB).
- Download the Parents and Guardian’s Guide for School Leavers, which summarises the resources and information available to help you explore all the education, training, and work options available to your young person.
School Leavers Information Service
- navigate the School Leavers Information Kit (SLIK),
- access and use the Your Career website and tools; and
- find relevant support services if needed.
Word Of The Week: Vandal
Noun
1. a person who deliberately destroys or damages property belonging to others or everyone. 2. someone who deliberately damages things, especially public property. 3. A person who needlessly destroys, defaces, or damages things - for example; environmental vandalism.
Vandal, member of a Germanic people who maintained a kingdom in North Africa from 429 to 534 CE and who sacked Rome in 455.
Etymology
1660s, “wilful destroyer of what is beautiful or venerable”, from Vandal, referring to a member of an ancient Germanic people, the Vandals, who are associated with senseless destruction as a result of their sack of Rome under King Genseric in 455. During the Enlightenment, Rome was idealized, while the Goths and Vandals were blamed for its destruction. The Vandals may not have been any more destructive than other invaders of ancient times, but they did inspire English poet John Dryden to write, Till Goths, and Vandals, a rude Northern race, Did all the matchless Monuments deface (1694). However, the Vandals did intentionally damage statues, which may be why their name is associated with the vandalism of art. The coining of French Vandalisme by Henri Grégoire in 1794 to describe the destruction of artwork following the French Revolution popularized the idea further, and the term was quickly adopted across Europe, including as English vandalism.
The ethnonym for Vandal is attested as Wandali and Wendilenses by Saxo, as Vendill in Old Norse, and as Wend(e)las in Old English, all going back to a Proto-Germanic form reconstructed as Wanđilaz. The etymology of the name remains unclear. According to linguist Vladimir Orel, it may stem from the Proto-Germanic adjective wanđaz ('turned, twisted'), itself derived from the verb wenđanan (or winđanan), meaning 'to wind'. Alternatively, it has been derived from a root wanđ-, meaning 'water', based on the idea that the tribe was originally located near the Limfjord (a sea inlet in Denmark). The stem can also be found in Old High German wentilsēo and Old English wendelsǣ, both literally meaning 'Vandal-sea' and designating the Mediterranean Sea
Environmental Vandalism: an example
Did you know that many of the native orchids that grow only in our area are underground for much of the year as tubers and cannot be seen? They only appear when it is their time to bloom - first you will see the stem, then the leaves, then finally, the flower.
These plants underline the first principle of Bush Regeneration, which is; “Minimal soil disturbance”.
What goes on underground drives the whole community and is a very fragile mechanism. It is difficult to see the results of disturbance, such as decline of the Purple Copper Butterfly (Conservation status in NSW: Endangered, Commonwealth status: Vulnerable) that depends on a species of ant to protect its caterpillars, while both ant and caterpillar depend on the Bursaria spinosa plant which depends on a micro fungi for its nutrition and communication. No Bursaria – no Butterfly. There are flowers that depend on a wasp for pollination that must lay its eggs into Christmas beetle larvae, while the Christmas beetle depends on a large Eucalypt that also needs soil micro fungi for its nutrition. No fungi - no wasp - no beetle -no tree. There are plants that need ants to carry their seed underground and pay them with little edible attachments to the seed. No ants – no seedlings. Nearly every plant needs a friendly soil fungus (mycorrhiza) to help its roots take up food.
All of the systems in the ecology depend on the agents of decay in the soil and litter to break down the fallen organic mater to provide their food - and so the cycles are connected. Without expert observation we cannot assess the state of the micro-organisms and the complex relationships in the under- world that drive the whole community.
The Pittwater Spotted Gum Forest, is another example, and listed as Endangered. This occurs on shale-derived soils with high rainfall on lower hillslopes on the Narrabeen group - Newport Formation, on the Barrenjoey Peninsula and western Pittwater foreshores. The major remnants on the Peninsula are within Council reserves; McKay Reserve, Angophora Reserve and Stapleton Park.
Another is the endangered Angus's Onion Orchids that grow here, these occur on soils in the restricted ridgetop lateritic soils in the Duffys Forest - Terrey Hills - Ingleside and Belrose area. There are also remnants of the Duffys Forest vegetation community, also listed as an Endangered ecological community in the NSW Threatened Species Conservation Act, further north in Pittwater too.
Is there really that much left that we can continue destroying it without thought or feeling? No, there isn't.
Guess what else needs thriving and cared for ecological communities to exist?;
Without a flourishing plant community driving the world through photosynthesis there is no oxygen for us.
The digging, mounding, compacting, introduction of weed seed and erosion of soil in the creation of tracks has damaging repercussions that are not immediately visible. What happens in the reserves can be described as a web of life, like a spider’s web: if you destroy it anywhere, the whole structure trembles and parts may collapse.
Using social media for your holiday ‘inspo’ can be risky and even dangerous – here’s why
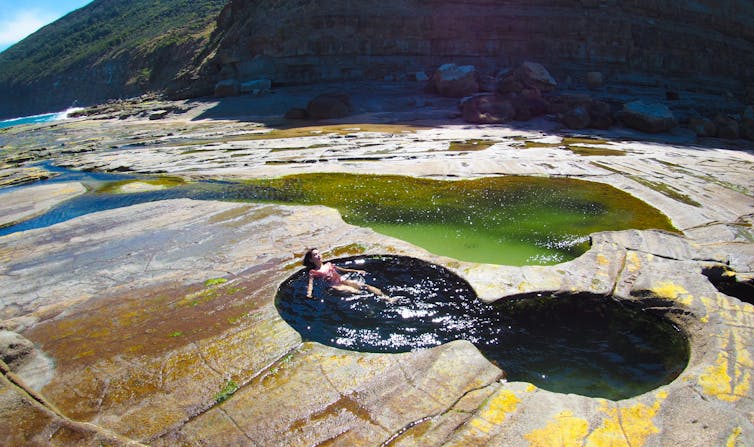
How do you choose your next travel destination? Social media platforms like Instagram and TikTok are handy tools for holiday research, full of #inspo for new and beautiful places to go.
However, behind those mesmerising selfies, highlights and reels, there’s often a stark reality that isn’t shared. Our ongoing research shows that dangers abound from social media related misadventures. These include the hidden dangers of getting to the location, as well as the ecological strains on sites that get overcrowded with tourists.
Australia, with its breathtaking natural wonders, is no stranger to the downsides of social media tourism. Many people have been injured, needed rescue or even perished when visiting trendy places.
The Illusion Of Safety
Influencers are in the business of presenting the best version of their experiences – not necessarily the safest. Our interviews with influencers who make content of beautiful places in nature, reveal that they see themselves as entertainers more than guides.
When it comes to the risks associated with the places they promote, they don’t view safety communication as their responsibility.
The Figure Eight Pools in New South Wales’ Royal National Park are one potent reminder of how online portrayals and reality don’t always match up. The photos showcase tranquil pools with glistening waters. But many visitors, enticed by these images, have faced the peril of sudden large waves washing over the rock shelf and even causing injuries.
Babinda Boulders, near Cairns in Queensland, is another such location. Wrapped in lush rainforests, this waterhole might seem inviting, but its tragic history of drownings speaks volumes – 21 drownings since 1965, and three since 2020.
Despite this, the pull of picturesque posts lures visitors into prohibited and dangerous areas.
Josephine Falls in Queensland has also experienced numerous incidents, all requiring resource-intensive rescues. Unfortunately, for many visitors, the warnings provided by Queensland Parks and Wildlife Service are to no avail – the lure of social media content is simply too strong.

A Burden On Local Infrastructure
Aesthetically pleasing, curated tourism content sets unrealistic expectations. Visitors who want to see the “insta-famous” scenery often find themselves underprepared for the actual experiences, sometimes leading to unsafe choices.
Drone shots can be particularly misleading. While they capture expansive vistas from above, they mask the ground-level challenges and dangers.
The Balconies in the Grampians National Park in Victoria is another infamous spot for taking risky photos for Instagram. To get the photo they came for, tourists must traverse a barrier. The viral content has led ever-increasing numbers of people to these rocks for a shot – risking their lives for the same photo hundreds of others have posted.
Additionally, geotagging (attaching metadata, such as latitude and longitude coordinates, to a photo) has its merits, offering travellers directions to exact locations. However, it’s a double-edged sword.
When a location becomes popular on social media, the influx of visitors can strain local infrastructure. As Hyams Beach in NSW went viral on various platforms, the once-peaceful coastal village grappled with traffic congestion and overwhelmed local resources.
Lincoln’s Rock in the Blue Mountains in NSW, once a little-known spot, was transformed by geotagged posts into a magnet for tourists and influencers. Some would engage in risky behaviours at the cliff edge. It’s one of many lookouts that once had few footprints, and is now a popular vista with little infrastructure.
Some regional areas simply don’t have the infrastructure or capacity to handle a large influx of tourists. As social media algorithms push trending posts even further, once-secluded gems face threats of overtourism.
Be A Responsible Tourist
While it’s easy to fall prey to the siren call of viral destinations, it’s essential to approach with caution and do proper research before you set out.
It’s important to stay aware of your surroundings, especially in natural areas, and not get tunnel vision, or “tourist gaze”.
Fortunately, in Australia, national parks provide detailed information about popular locations. They can be relied upon to give accurate information and a true representation of the area, including safety information and guides for great hikes and the best lookouts.
All states in Australia have parks agencies that provide this information online (and they’re on social media, too).
Things To Keep In Mind
Social media is a highlight reel. Before diving into that enticing pool or hiking that mountain, do thorough research. Don’t let it be your last swim
engage with locals, understand the history, the culture, and importantly, respect the environment
it’s also essential to challenge the content we consume and share. By geotagging responsibly and authentically portraying experiences, we can safeguard Australia’s treasures
social media is a powerful tool but needs to be wielded wisely. Australia’s natural wonders are worth more than just a fleeting snapshot; they deserve our utmost respect and care.
So, as you scroll through your feed, dreaming of your next escape, remember that every location has a story beyond its pixels. Dive deep, explore responsibly, and treasure the real over the reel. ![]()
Samuel Cornell, PhD Candidate, School of Population Health, UNSW Sydney and Amy Peden, NHMRC Research Fellow, School of Population Health & co-founder UNSW Beach Safety Research Group, UNSW Sydney
This article is republished from The Conversation under a Creative Commons license. Read the original article.
NASA’s robotic prospectors are helping scientists understand what asteroids are made of – setting the stage for miners to follow someday
The cars, cellphones, computers and televisions that people in the U.S. use every day require metals like copper, cobalt and platinum to build. Demand from the electronics industry for these metals is only rising, and companies are constantly searching for new places on Earth to mine them.
Scientists estimate that lots of these metals exist thousands of miles beneath Earth’s surface, in its molten core, but that’s far too deep and hot to mine. Instead, some companies hope to one day search for deposits that are literally out of this world — on asteroids.
The commercialization of asteroid mining is still a ways off, but in October 2023, NASA launched a scientific mission to explore the metal-rich asteroid Psyche. The main goal of the mission is studying the composition and structure of this asteroid, which could tell scientists more about Earth’s core since the two objects might have a similar makeup.
Both likely contain platinum, nickel, iron and possibly even gold – materials of commercial interest.
I am a planetary geologist whose work explores other planets and astronomical objects like Mars, Venus and the Moon. I will be following the Psyche mission closely, as this is the first time that scientists will be able to learn about the composition and structure of a possible piece of a planetary core similar to the Earth’s, without indirect seismic or magnetic measurements, or replicating the pressure and temperature conditions of the Earth’s core in our labs.
With the spacecraft estimated to arrive at the asteroid’s orbit in 2029, the findings from the Psyche mission will provide unique insights into the type of metals present on the asteroid’s surface, as well as their amount, and the minerals containing these metals. This data is essential both for scientists like me exploring the formation and evolution planetary bodies, as well as for companies investigating the possibility of asteroid mining.
Asteroid Formation
Asteroids come in a variety of sizes. Some are the size of a town, while others are the size of a state. Most asteroids are made of rocks and represent the leftovers from the early formation of our solar system around 4.6 billion years ago.

Not every asteroid is the same – some, like Bennu, the target of NASA’s OSIRIS-REx mission, are rich in carbon. These are very old, and they will teach scientists more about how planets formed and how life may have begun on Earth.
Others, like Psyche, are made of metals and potentially result from one or more collisions between astronomical objects when the solar system was forming. These collisions left debris flying through space — including potential pieces of a planet’s metal-rich core. A NASA spacecraft will orbit and analyze the surface of Psyche.
Mining In Space
Not every mineral deposit on Earth is mineable. Companies first look for deposits with a high level of metal purity. They also investigate how affordable and feasible extracting the metal would be before choosing where to mine.
Similarly, before mining an asteroid, companies will have to think about all those factors, and they’ll have to come up with the infrastructure needed to mine at a distance and transport the metals they mine hundreds of millions of miles back to Earth. The technology to do that is still years away, and transporting metals would require major funding.
A few companies around the world have already started to think about what the best and lowest cost approach would be, drawing from processes similar to those used on Earth.
The first step would be finding a mineable metal deposit. Next, they’d drill and extract the metals on the asteroid. One of the most important differences with Earth mines is that each step would be undertaken remotely with spacecrafts orbiting around the asteroid and robots landing on its surface. Then, a spacecraft would send the resulting materials back to Earth.
Asteroid mining plans are still at their earliest stages. A few companies like Planetary Resources and Deep Space Industries, with goals to extract metals from space, were acquired by other companies.
Experts can’t quite tell yet how acquiring valuable metals from asteroids would affect the global economy, but these metals could potentially flood the market and lower their values.
The Psyche mission is a huge step in figuring out what sort of metals are out there, and it may also answer questions about the composition and properties of Earth’s core.![]()
Valerie Payré, Assistant Professor of Earth and Environmental Sciences, University of Iowa
This article is republished from The Conversation under a Creative Commons license. Read the original article.
Why young workers are leaving fossil fuel jobs – and what to do if you feel like ‘climate quitting’

Are you frustrated with your employer’s lack of commitment to sustainability? Maybe “climate quitting” is for you. Climate quitting means leaving your job due to concerns about your employer’s impact on the climate or because you want to work directly on addressing climate issues.
If you’re contemplating leaving your job over climate concerns, you’re not alone. Half of Gen Z employees (people born between the late 1990s and early 2010s) in the UK have already resigned from a job due to a conflict in values. And 48% of people aged 18–41 say they are willing to take a pay cut to work for a company that aligns with their sustainability values.
Oil and gas companies in particular are finding it difficult to attract new talent, in part because they have been losing credibility amid the growing climate crisis. This trend of climate quitting only adds to the industry’s talent challenges.

This article is part of Quarter Life, a series about issues affecting those of us in our twenties and thirties. From the challenges of beginning a career and taking care of our mental health, to the excitement of starting a family, adopting a pet or just making friends as an adult. The articles in this series explore the questions and bring answers as we navigate this turbulent period of life.
You may be interested in:
How to challenge toxic behaviour and help someone being bullied or harassed at work
How you can future-proof your career in the era of AI
Three mindfulness and meditation techniques that could help you manage work stress
Our research has involved interviewing dozens of people – including many who are still in the early stages of their careers – who have left the oil and gas industry because of their environmental concerns. The industry is often blamed for its contribution to the climate crisis, making it an ideal case to study climate quitting – despite its own efforts to downplay its role in global warming.
Leaving your job is never an easy decision, and the climate quitters we spoke to revealed that they had actually enjoyed many aspects of their jobs. They were paid well, found their work intellectually rewarding and had opportunities for career development and travel. So, what is motivating people to quit their jobs over climate concerns?
The Urgency Of The Climate Crisis
Based on the results of a survey from 2022, people aged 16–29 are the age group most prone to feeling “very worried” about climate change. Interviews from our ongoing research confirmed this trend.
Most of the people we interviewed talked about the accelerating pace and urgency of tackling the climate crisis. Many mentioned the International Energy Agency’s 2021 Report, which proclaimed that new oil and gas exploration must stop immediately if we are to meet our climate targets.
But our interviewees report that their employers’ actions and priorities did not align with this sense of urgency to transition. Some reported that their employers were ignoring these warnings – even rolling back their prior climate commitments.
One of our interviewees said: “I really did not want it on my conscience that I was making the world worse, that I was using the talents and skills that I acquired for many years of study to make the world worse and bring us on the brink of a climate disaster.”

Organisational Hypocrisy
A study we carried out in 2021 found that many companies in the energy sector go for clean rhetoric instead of green action and dilute their responsibility to take climate action. Our interviewees witnessed hypocrisy too, or a difference between what their corporate employers publicly announced regarding the clean energy transition and what they prioritised internally.
Some research has found that oil and gas employees are often able to live with this dissonance. But the people we interviewed reported a growing sense of discomfort and value conflict at work, which ultimately got them thinking about leaving.
This comes as no great shock. A study from 2012 found that when employees in the oil and gas industry perceived their employers to be only pursuing environmental actions or claims in order to present a climate-friendly public image, they lose trust and identification with their employers.
Failure To Create Change From Within
Our prior research finds that people often join organisations with the specific goal of trying to get their employers to better address climate change and sustainability, by taking on new roles such as sustainability managers. However, many of the interviewees from our unpublished research ultimately decided to quit following their failed attempts to affect change from within. Some had joined sustainability task forces at work, while others tried to move into roles that were focused on the clean energy transition. But, by and large, they did not feel that they were having the impact that they desired.
This is probably because most oil and gas companies dedicate only a small fraction of their investments and operations towards fossil fuel alternatives. This means there are few internal opportunities for climate-conscious employees.
Taking On A Climate Job
Research finds that it’s often easier for oil and gas employees with climate concerns to overcome their sense of value conflict and dissonance by changing their own minds rather than changing their jobs. But with new opportunities in the renewable energy sector, there is increasingly a place for energy experts to go.
The career trajectories of our interviewees conform with grave predictions for talent in the fossil fuel industry. A survey of 10,000 energy professionals in 2022 found that 82% of respondents would consider switching out of oil and gas within the next three years. Half of these people said they hoped to move into renewables.

If you’re considering this type of move, there is a growing community of organisations with the mission to mobilise for climate quitting – including Work on Climate, Terra.do and My Climate Journey. They provide mentoring, support networks, job boards and training to help people move into climate jobs.
It may be time for oil and gas firms to finally reconsider their business decisions in the wake of employees’ concerns about the climate crisis and in pursuing value alignment in their work.![]()
Grace Augustine, Associate Professor in Business & Society, University of Bath and Birthe Soppe, Associate Professor of Organisation Studies, University of Innsbruck
This article is republished from The Conversation under a Creative Commons license. Read the original article.
The best techniques for being a cricket fast bowler, according to science
Paul Felton, Nottingham Trent UniversityTwenty years ago, Shoaib Akhtar became the first person recorded to bowl at 100mph (161km per hour) during the 2003 One-Day International Men’s World Cup match for Pakistan against England. There was an expectation afterwards that this feat would become a regular occurrence.
As humans have continued to run faster, throw further and jump higher, it was believed that this milestone would be a stepping stone consigned to history similar to Roger Bannister breaking the four-minute mile. It was thought it might also act as a catalyst for serious worldwide improvement in fast bowling.
However, despite continuing improvement in the athletic ability of fast bowlers, the magical three-figure barrier has only been surpassed since by Brett Lee and Shaun Tait – and not for over ten years.
Has cricket fast bowling’s top speed stalled? During the current 2023 One-Day International Men’s World Cup being hosted in India, only a handful of bowlers have produced speeds over 90mph (145km per hour), with the fastest being around 95mph (153 km per hour).
The performance of cricket fast bowlers almost entirely depends on two factors. The first is the amount of momentum developed in the run-up and maintained before the front foot contacting the floor. The second is the technique employed to generate and transfer momentum within the body during the bowling phase between the front foot contacting the floor and the release of the ball from the bowler’s hand.
Previous research has highlighted that the fastest elite male bowlers generate more momentum in their run-up, adopting a movement strategy that aims to maintain and transfer this momentum into the throw instead of generating additional momentum from their muscles.
Testing The Limits
To investigate the limits of fast bowling performance, a world-leading predictive musculoskeletal computer simulation model of ten elite male fast bowlers (essentially a virtual clone of each bowler) was developed. It then optimised their technique to maximise the release speed of the ball.
Significantly, none of these bowlers were predicted by the computer model to break the 100mph barrier.
To understand why the top speed has stalled, it is important to consider how all the factors influencing human movement patterns affect the technique of fast bowlers.
The behaviour of all our movement patterns is shaped by three types of constraint. The first is organismic: these are constraints on the individual, such as their size, strength and range of motion. The second factor shaping movement patterns is the environment the individual interacts with, including the atmosphere, temperature, equipment and surfaces. The third shaping factor is the task, which involves constraints such as the goal of the activity, the rules and the intensity.
Our previous experiences of the movement – what we have seen, what we have been told and our previous performance of the movement – also affect individual technique in fast bowling.
The innate physiology of the fast bowler, an organismic constraint, provides the only potential area for development in fast bowling. The other constraints, such as environment and task, which often lead to scientific and technological development associated with improvements in other sports, are extremely limited in fast bowling. This is due to the lack of equipment and the simplicity of the activity.
The physiological aspect often considered to be associated with improvements in fast bowling performance is an increase in muscular strength, power and endurance. However, there’s a unique cricket bowling “task” constraint which requires bowlers to maintain a straight arm during the bowling phase. This significantly reduces the time available to complete the throwing movement.
Explosive Activation
Elite males complete the bowling phase in approximately 100 milliseconds. This is similar to the time required to explosively activate a single muscle. This limits the ability of bowlers to develop additional momentum using their muscles in the bowling phase and neutralises the effect of strength increases on ball speed.
This explains why maximising momentum generated during the run-up is preferred over generating muscular momentum during the bowling phase. It also explains why fast bowling top speeds have not increased despite recent advances in fast bowlers’ athletic abilities.
Interestingly, research on women fast bowlers has highlighted that bowlers who generate less momentum during the run-up and therefore have more time available to generate additional muscular momentum, adopt a movement pattern more akin to throwing. In this approach, the momentum generated in the run-up is added to via the use of large rotational torso muscles within the bowling phase.
Improvements to the performance of the large rotational torso muscles in men and women could possibly improve the generation of muscular momentum. But this approach is considered a sub-optimal technique by the research that’s been carried out on fast bowling.
A potential mechanism to increase the time available to develop more momentum from muscles would be to increase the range of motion that joints move through during the bowling phase.
Joint ‘Hypermobility’
Recent research has highlighted that, on average, elite fast bowlers with an increased range of motion in the hip and shoulder had greater ball release speeds. It was also suggested that the bowlers’ techniques were probably influenced by their range of motion during their early learning years.
In addition, elbow hyperextension – where the joint travels beyond a straight position – has been shown to increase the speed of ball release by up to 5% during the bowling phase. A common misconception, however, is that taller bowlers will bowl faster due to the benefit associated with increased limb length.
Unfortunately, as limbs get longer, they get more difficult to rotate. As muscular strength does not scale equally with limb length this becomes a disadvantage. Thus, an optimal height for fast bowlers probably exists, though we don’t know what it is.
Organismic factors linked with increased ball speed such as body shape, size and hypermobility are largely genetic. Since human evolution is extremely slow, advances in ball release speed are likely to follow at a similar pace.
The 100mph barrier, therefore, should be viewed more as a mountain that requires a once-every-generation bowler to scale rather than a dam in a river. The potential of this peak to grow is limited by the constraints of the task and by our innate physiology.![]()
Paul Felton, Senior Lecturer in Biomechanics in the School of Science and Technology, Nottingham Trent University
This article is republished from The Conversation under a Creative Commons license. Read the original article.
Bennelong and Phillip: wrestling with our historical assumptions through the entangled lives of two very different men

Despite the inherent chance and coincidence of Australian history, there’s a certain sense of inevitability when we trace our national narrative in hindsight. The sequence of chapters in our textbooks and syllabuses seems logical and coherent. Colonisation follows European imperialism and exploration. Suffrage follows the discovery of gold. Federation is realised after a growing national consciousness.
There’s a reason historians construct timelines: drawing a thread between moments turns the past into a sequence that forms the skeleton of our stories. We make narratives out of stuff that happened over time.
Review: Bennelong & Phillip: A History Unravelled – Kate Fullagher (Simon & Schuster)
That form of chronological sequencing isn’t innate, however. Western historical practice feels natural because it’s the way many of us have learnt history. The discipline is presented and understood “chronologically” – but its intrinsic nature belies the attention required to craft and curate a seamless logic of time.
As postcolonial scholars such as Dipesh Chakrabarty and Priya Satia have shown, the discipline of history itself has helped fashion a sense of inevitability, especially in histories of colonisation and imperial expansion. Indigenous histories and perspectives have often been relegated to the fringes of national narratives or framed in predictable tropes that saw them overwhelmed by historical “progress”.

How do we nudge at that overwhelming sense of inevitability? How might we inhabit the past and consider its chance and open-endedness, as well as its contrasting cultural readings?
Kate Fullagar’s important new work, Bennelong and Phillip: A History Unravelled, reaches into Australia’s early colonial history to tease out, quite literally, the threads of its past. In doing so, it brings a creative and original lens to a foundational relationship.
The book focuses on the curious entanglement between Arthur Phillip, the first Governor of New South Wales, and Woollarawarre Bennelong, a Wangal man born around 1764, who grew up by the Parramatta River.
Phillip was a British Royal Naval Officer with an extensive military career, including serving in the Napoleonic Wars and conflicts over Spanish colonies in South America. In 1786 he was appointed to lead the First Fleet, that famous flotilla of eleven ships filled with convicts and soldiers that established a penal colony in New South Wales in 1788.
Representing the might of a global and acquisitive Empire, Phillip has also been remembered for how he guided the colony in its early years (despite famine and unrest, as well as unimaginable isolation), along with his commitment to “establishing and maintaining friendly and peaceful relations” with Aboriginal people. His official orders to “conciliate their affections” and “live in amity and kindness with them” have framed the ways early Australian colonial histories presented Phillip as an emblem of the Enlightenment and loyal servant of the British Empire.
Bennelong was also a diplomat, a speaker of multiple languages and a curious, gregarious interlocutor. The historian Keith Vincent Smith described Bennelong’s childhood, growing up on the banks of the Parramatta River spearing snapper and cutting sheets of bark to build his own Nawi canoe. He was initiated as a teenager, where
scars were raised on his chest and arms and his upper front tooth was knocked out to show that he was a man. He could now take a wife and hunt kangaroos and dingoes.
Bennelong would have been about 24 when the First Fleet arrived. He was dramatically thrust into its world when kidnapped from a harbour beach in Manly in November 1789, along with Gadigal man Colebee, in a curious attempt to build relationships between the colonists and Aboriginal clans.
Despite that violent beginning, Bennelong became a critical member of that early intercultural dialogue and was also the first Aboriginal man to visit Europe and return.

Fullagar explores how the two men’s shared history did indeed shape Australia’s, but not simply in the way foundational narratives have tended to represent them.
Bennelong and Phillip’s life stories have been told and reproduced many times before – in histories, biographies and museum exhibits. Their figures grace our currency, monuments and galleries and their names mark our maps. They are perhaps better known as tropes than actual people – representing a curious, bifurcated tale of rationality and tragedy, Enlightenment and tradition, (colonial) beginnings and (Aboriginal) endings.
Yet when Phillip was speared through the shoulder at Kay-Yee-My (Manly Cove), in retaliation for Bennelong and Colebee’s kidnapping and imprisonment, no one could have known what lay ahead. Similarly, when the colony was experiencing famine and its very existence was uncertain, or when a smallpox epidemic wiped out approximately half of the surrounding Aboriginal clans, we cannot assume people knew what would come next.

It’s difficult to understand the precariousness and contingency of this history. To do this, Fullagar reaches back in time, but does so in reverse, by inverting the narrative of their relationship. She does this to tease out the lives of the two men in their own right and on their own terms. Critically, her book also exposes the architecture historians draw on, such as using hindsight and chronology, as well as narrative, to make a story appear seamless.
Beginning At The End
Bennelong and Phillip begins at the end, with the funerals of these two men, inviting us to think about how their contrasting but intersecting lives were remembered. Then we move back in time, event by event, chapter by chapter, through the colonial period and before it, to their beginnings.
It’s an inspired approach that forces readers to wrestle with our own historical assumptions. It makes clear that for this period in Australia’s colonial past, the story certainly isn’t one of linear progress, but a messy, often shared, series of entanglements.
Given the history discipline’s own legacy in advancing settler colonialism, policing whose stories can be told, how and by whom, Fullagar is acutely aware of its limitations in retracing this period. Can a work of history, even one as original and imaginative as this one, successfully reclaim this story from the dominant narrative of early Australia, where the settler colony’s success is assumed, because we’re still living in it? It’s a question she wrestles with throughout.
When so much Australian historiography has framed the colonial period as a set of “befores” and “afters”, “pre-history” and “history”, or “firsts” and “lasts”, this book throws the logical sequence of the colony on its head.
Fullager manages to reach back in time to disrupt and pick apart the past, without assuming she can inhabit the minds of these two men beyond her own lived experience and world view. In a memorable scene, she describes Bennelong’s visit to the London’s Parkinson Museum in 1793, where he and his Wangal Countryman Yemmerrawanne were confronted with artefacts taken from Australia, including possibly spiritually potent objects and human remains.
She cleverly reframes and describes 18th century British culture and society as an ethnographical study, suggesting what it might have looked like through Bennelong’s eyes (subtly alluding to those early colonial accounts by Watkin Tench and David Collins, which were full of cultural curiosity for the “other”). And she deftly manages and highlights the unevenness of the colonial archive, reminding us the inequity of our cultural memory doesn’t obviate the need to be attuned to a diversity of experience.
Bennelong and Phillip gives us a new, original lens onto this origin story. We see a larger, more complex picture of Phillip, for whom New South Wales was just one chapter of imperial service. And we’re offered a much richer, nuanced account of Bennelong, who Fullagar reads in context and on Country.
The book’s narrative reversal requires some skilful management to make sense. Fullagar uses helpful annotations at the beginning of each chapter, reminiscent of early colonial texts, which often included the same.
She also writes beautifully and clearly. That mastery of time and prose is essential, because this isn’t the sort of history book you can flick through on autopilot. Our narrative habit as readers to move forward through time is constantly being checked throughout. Maintaining that coherence requires work from the reader but, if this book is a little unsettling, that’s probably a good thing.
Bennelong and Phillip is a disciplinary accomplishment. Given its contribution to our national conversation, I was shocked to read reports of the Australian Catholic University’s draft plans to restructure more than 30 full-time equivalent jobs across the humanities, Fullagar’s included. In this ghastly “Hunger Games” scenario, colleagues compete for a reduced number of positions in their own area.
Given the heated debate around the Voice referendum, which demonstrated Australian history is very much still up for grabs, the sort of historical contemplation and reconfiguration Bennelong and Phillip provides is both critical and timely. I can’t think of a worse moment for a university to walk away from such important work.![]()
Anna Clark, Professor in Public History, University of Technology Sydney
This article is republished from The Conversation under a Creative Commons license. Read the original article.
What is ‘fried rice syndrome’? A microbiologist explains this type of food poisoning – and how to avoid it

A condition dubbed “fried rice syndrome” has caused some panic online in recent days, after the case of a 20-year-old who died in 2008 was resurfaced on TikTok.
“Fried rice syndrome” refers to food poisoning from a bacterium called Bacillus cereus, which becomes a risk when cooked food is left at room temperature for too long.
The 20-year-old college student died after reportedly eating spaghetti that he cooked, left out of the fridge, and then reheated and ate five days later.
Although death is rare, B. cereus can cause gastrointestinal illness if food isn’t stored properly. Here’s what to know and how to protect yourself.
What Is ‘Fried Rice Syndrome’?
Baccilus cereus is a common bacterium found all over the environment. It begins to cause problems if it gets into certain foods that are cooked and not stored properly.
Starchy foods like rice and pasta are often the culprits. But it can also affect other foods, like cooked vegetables and meat dishes.
Certain bacteria can produce toxins. The longer food that should be refrigerated is stored at room temperature, the more likely it is these toxins will grow.
B. cereus is problematic because it has a trick up its sleeve that other bacteria don’t have. It produces a type of cell called a spore, which is very resistant to heating. So while heating leftovers to a high temperature may kill other types of bacteria, it might not have the same effect if the food is contaminated with B. cereus.
These spores are essentially dormant, but if given the right temperature and conditions, they can grow and become active. From here, they begin to produce the toxins that make us unwell.
What Are The Symptoms?
The symptoms of infection with B. cereus include diarrhoea and vomiting. In fact, there are two types of B. cereus infection: one is normally associated with diarrhoea, and the other with vomiting.
Illness tends to resolve in a few days, but people who are vulnerable, such as children or those with underlying conditions, may be more likely to need medical attention.
Because the symptoms are similar to those of other gastrointestinal illnesses, and because people will often get gastro and not seek medical attention, we don’t have firm numbers for how often B. cereus occurs. But if there’s an outbreak of food poisoning (linked to an event, for example) the cause may be investigated and the data recorded.

We do know B. cereus is not the most common cause of gastro. Other bugs such as E. coli, Salmonella and Campylobacter are probably more common, along with viral causes of gastro, such as norovirus.
That said, it’s still worth doing what you can to protect against B. cereus.
How Can People Protect Themselves?
Leftovers should be hot when they need to be hot, and cold when they need to be cold. It’s all about minimising the time they spend in the danger zone (at which toxins can grow). This danger zone is anything above the temperature of your fridge, and below 60°C, which is the temperature to which you should reheat your food.
After cooking a meal, if you’re going to keep some of it to eat over the following days, refrigerate the leftovers promptly. There’s no need to wait for the food to cool.
Also, if you can, break a large batch up into smaller portions. When you put something in the fridge, it takes time for the cold to penetrate the mass of the food, so smaller portions will help with this. This will also minimise the times you’re taking the food out of the fridge.
As a general guide, you can follow the two hour/four hour rule. So if something has been out of the fridge for up to two hours, it’s safe to put it back. If it’s been out for longer, consume it then and then throw away the leftovers. If it’s been out for longer than four hours, it starts to become a risk.
The common adage of food safety applies here: if in doubt, throw it out.
It’s also worth keeping in mind the general principles of food hygiene. Before preparing food, wash your hands. Use clean utensils, and don’t cross-contaminate cooked food with raw food.![]()
Enzo Palombo, Professor of Microbiology, Swinburne University of Technology
This article is republished from The Conversation under a Creative Commons license. Read the original article.
Japanese manhole covers are painted with flowers, bridges, mountains and mascots – and now they’re for sale

Visitors to Japan are usually primed to look up – at the vast skyscrapers, the ornate temple gates, the traditional timber-framed guesthouses. Those who look down at their feet, though, might have noticed something equally intriguing on the ground. Ornate manhole covers in wrought iron, often plain, sometimes brightly painted, dot the country’s pavements, separating street life from the sewers that run below.
These objects have garnered a considerable following of “manholers” (as the hobbyists are known), who will be delighted to learn that city officials in Kyoto and other local authorities are now putting up retired covers for sale. For ¥5,500 (£31), fans can purchase their own 90kg piece of Japanese street furniture.
A construction ministry employee came up with the idea of decorative manhole covers in the late 1970s. It was an attempt to get the public on board not just with costly upgrades to the sewer system, but with the existence of the sewer system itself.
Beyond such efforts at corporate social responsibility, though, these urban ornaments connect to a long-standing historical urban planning concept, “machizukuri”. They speak to efforts revive local communities and wider regional economies.
A Successful Marketing Ploy
Today more than 90% of municipalities have their own distinctive manhole cover designs. The motifs used are often rooted in local history, geography and culture.
They include the usual traditional cherry blossoms, landscapes, castles, bridges, birds and, as the Japan Ground Manhole Association website puts it, the wind and the Moon. Others reference sports teams, anime and local mascots.
Yokohama, in the summer of 2023, got four new Pikachu lids, when the city became the first in Japan to host the annual Pokemon world championship. These weren’t the first Pokemon-themed covers though. On the Pokelids website you can see similar designs mapped out across the country, from Hokkaido in the north to Kyushu in the south.

Manhole designs now adorn keychains, t-shirts and mugs, as well as a trading card game. An annual manhole summit has been organised since 2012. The tenth edition, held in Tokorozawa on December 1 2022, attracted an estimated 14,000 visitors.
This popularity is partially down to the successful publicity of the local agencies that manage the sewerage networks. Replacing worn-out covers is expensive. As the sewers are mainly run by local authorities, it is taxpayers’ money that gets spent on replacements – so getting the public on side is crucial. Capitalising on the covers’ popularity could also now be a good source of revenue for debt-laden public bodies.

Community Building
Manhole covers sometimes provide tourist information at sightseeing spots and sports events or outline emergency escape routes in the event of an earthquake or tsunami. Some include QR codes and augmented reality.
This speaks to the urban design trend of machizukuri, a term which combines machi (best translated as “community” or “shared space”, a place both physical and intangible in which community comes together and social activities take place) with zukuri (which means “producing” and “nurturing”). The idea connects urban planning with community building.
By the late 1960s, the environmental damage caused by Japan’s rapid economic growth after 1945 was becoming impossible to ignore. The period was also a time of tumultuous student and anti-war protest.

Machizukuri emerged as an idealistic philosophy that aimed to improve the everyday environment through a bottom-up transformation, involving citizens, experts and local officials. The idea was to enliven urban areas by energising residents and reveal the spirit of the locality.
The term was more widely used in the mid-1970s and through the 1980s, as national economic policy brought increasing free trade in agriculture, relocated large factories overseas and privatised state-owned businesses. These neo-liberal reforms were a major cause of the now well-known problems of rural depopulation and ageing in Japan.

Ultimately, the responsibility for rural revitalisation shifted on to municipalities. Local authorities were tasked with finding creative ways to sustain and revive local economies. The idealistic philosophical notion of machizukuri of the late-1960s was coopted by the changing economic imperatives of central government.
In the 1990s, tourism – domestic and inbound foreign – became a primary tool for machizukuri. Local authorities in declining rural areas tapped into a national sense of nostalgia in their campaigns to attract domestic visitors. Small towns and villages became the repository of what the popular mass media came to describe as the “real Japan”, the one left behind and forgotten in the rapid transformation of the postwar years.
The bubble economy of the early 1990s saw amusement parks, golf clubs, holiday resorts and out-of-town shopping centres populate the landscape and create jobs. Transportation to major cities was vastly improved through high-speed rail and highway networks. Local specialities – food, farming products, arts and crafts – were commodified and marketed. As elsewhere, the connection between localism and economic ideologies, such as post-developmentalism and neoliberalism, has become central to the growth of consumer society in Japan.

Fans who decide to invest in a manhole cover are not just buying a pretty, heavy piece of artwork but something with cultural significance, that speaks to a feeling of shared belonging and communal life. The fact that they are even for sale also highlights how fragile – how under threat – this feeling is. Local communities, after all, have been destroyed by the neoliberal economy of the last four decades.
Machizukuri effectively creates a marketplace for nostalgia. These decorative manhole covers are simply one more element in the commodification of the spaces and places in which everyday life takes place. A pragmatic approach to sewerage management has become another opportunity to go shopping.![]()
Martyn Smith, Lecturer in Japanese Studies, University of Sheffield
This article is republished from The Conversation under a Creative Commons license. Read the original article.
Book Of The Month November 2023: The Useful Native Plants Of Australia, (Including Tasmania)
by Maiden, J. H. (Joseph Henry), 1859-1925
Publication date 1889. Publisher Sydney, Turner and Henderson.
Capability Review: Department Of Health And Aged Care
- understand the story – the health, aged care and sporting settings we operate in
- tell the story – what we do well and where we can improve
- shape the story – what the future of health, aged care and sporting policy and programs looks like.
- further improve the policies and programs we develop and deliver
- deepen our engagement with the community and stakeholders
- empower our staff to have a clear understanding of their role, greater autonomy and a strong feeling of contribution.
Medicare Bulk Billing Strengthened
A New Men's Table At Narrabeen

Improving Deep Sleep May Prevent Dementia: Study Finds
How 22 minutes of exercise a day could reduce the health risks from sitting too long

People in developed countries spend an average of nine to ten hours a day sitting. Whether it’s spending time in front of a computer, stuck in traffic, or unwinding in front of the TV, our lives have become increasingly sedentary.
This is concerning because prolonged time spent sitting is linked to a number of health issues including obesity, heart disease, and certain types of cancers. These health issues can contribute to earlier death.
But a new study suggests that for people over 50, getting just 22 minutes of exercise a day can lower the increased risk of premature death from a highly sedentary lifestyle.
What The Researchers Did
The team combined data from two studies from Norway, one from Sweden and one from the United States. The studies included about 12,000 people aged 50 or older who wore wearable devices to track how active and sedentary they were during their daily routines.
Participants were followed up for at least two years (the median was 5.2 years) during the study period, which spanned 2003-2020.
Analyses took several lifestyle and health factors into account, such as education, alcohol intake, smoking status, and previous history of heart disease, cancer and diabetes. All this data was linked to national death registries.
A 22 Minute Threshold
A total of 805 participants died during follow up. The researchers found people who were sedentary for more than 12 hours a day had the highest risk of death (a 38% higher risk than people who were sedentary for eight hours).
However, this was only observed in those who did less than 22 minutes of moderate to vigorous physical activity daily. So for people who did more than 22 minutes of exercise, there was no longer a significantly heightened risk – that is, the risk became generally similar to those who were sedentary for eight hours.
Higher daily duration of physical activity was consistently associated with lower risk of death, regardless of total sedentary time. For example, the team reported an additional ten minutes of moderate to vigorous physical activity each day could lower mortality risk by up to 15% for people who were sedentary less than 10.5 hours a day. For those considered highly sedentary (10.5 hours a day or more), an additional ten minutes lowered mortality risk by up to 35%.
The Study Had Some Limitations
The team couldn’t assess how changes in physical activity or sedentary time over several months or years may affect risk of death. And the study included only participants aged 50 and above, making results less applicable to younger age groups.
Further, cultural and lifestyle differences between countries may have influenced how data between studies was measured and analysed.
Ultimately, because this study was observational, we can’t draw conclusions on cause and effect with certainty. But the results of this research align with a growing body of evidence exploring the relationship between physical activity, sedentary time, and death.
It’s Positive News
Research has previously suggested physical activity may offset health risks associated with high sedentary time.
The good news is, even short bouts of exercise can have these positive effects. In this study, the 22 minutes wasn’t necessarily done all at once. It was a total of the physical activity someone did in a day, and would have included incidental exercise (activity that’s part of a daily routine, such as climbing the stairs).
Several studies using wearable devices have found short bursts of high-intensity everyday activities such as stair climbing or energetic outdoor home maintenance activities such as mowing the lawn or cleaning the windows can lower mortality, heart disease and cancer risk.
A recent study using wearable devices found moderate to vigorous bouts of activity lasting three to five minutes provide similar benefits to bouts longer than ten minutes when it comes to stroke and heart attack risk.
Several other studies have found being active just on the weekend provides similar health benefits as being active throughout the week.
Research has also shown the benefits of physical activity and reducing sedentary time extend to cognitive health.
Routines such as desk jobs can foster a sedentary lifestyle that may be difficult to shift. But mixing short bursts of activity into our day can make a significant difference towards improving our health and longevity.
Whether it’s a brisk walk during lunch, taking the stairs, or even a short at-home workout, this study is yet another to suggest that every minute counts.![]()
Matthew Ahmadi, Postdoctoral Research Fellow, Faculty of Medicine and Health, University of Sydney and Emmanuel Stamatakis, Professor of Physical Activity, Lifestyle, and Population Health, University of Sydney
This article is republished from The Conversation under a Creative Commons license. Read the original article.
I was a geriatrician on Old People’s Home for Teenagers. Here’s why I joined this TV experiment

Many people will have heard about “intergenerational practice” via the TV.
This is the purposeful bringing together of different generations, aiming to benefit all involved. It’s the idea central to ABC TV’s Old People’s Home for Teenagers, and its predecessor Old People’s Home for 4 Year Olds. Both show the positive aspects of mixing age groups, for the older people featured, as well as the teenagers or preschoolers.
I’m a geriatrician, a doctor who specialises in the medical care of older people, one of two geriatricians who took part in this TV experiment. Here’s why I got involved.
The Benefits Of Mixing It Up
The positive aspects of mixing age groups may seem intuitive. Just think of how special it can be when grandparents spend time with their grandchildren. When older and younger people are together, each can share their experiences and perspectives. Meaningful connections can develop.

But in Australia today, many older people have no such opportunities. Multi-generational households are the exception, not the norm.
One quarter of people aged 65 and over living in private homes live alone. Nearly 200,000 live in retirement villages and around the same number live in residential aged care. Both of the latter, by definition, accommodate only a single generation.
Intergenerational programs overcome these barriers by creating a structured and supported forum in which two age groups can regularly connect.
These programs can involve different populations: from toddlers through to university students, from independent, active retirees through to aged care residents and hospital patients.
Programs can take several forms, for example:
playgroups are conducted in aged care facilities
childcare and aged care facilities are in the same location
older volunteers in the community take part in formal mentorship programs for young adults.
The common aim is to improve wellbeing, restore purpose, and bring joy to older participants, while helping to develop social skills, confidence and empathy in young people. These programs can potentially also address ageism, by creating understanding and empathy for each generation and by challenging negative stereotypes.
There Are Challenges Ahead
There are wide-ranging challenges ageing may throw at us – an increased burden of chronic disease and frailty, a decline in physical and cognitive abilities, or changes in hearing, vision and balance.

Changes in occupational and social roles often also occur as we get older, for instance, as older people retire from paid work or care for a sick partner. Conversely, older people may lose their role as caregivers, after grandchildren grow up, or after the loss of a loved one.
All these ageing-related changes can lead to a loss of social connection and loneliness. Loneliness itself is bad for health. Loneliness increases risks for depression, cardiovascular disease, dementia and may even lead to a shorter life span. Reducing loneliness in older adults remains a challenge.
How I Got Involved
So when a chance to become involved in Old People’s Home for 4 Year Olds, I eagerly jumped on board. This featured an experimental intergenerational preschool. Young and old took part in a series of structured and supported activities such as playing dress-ups, going on walks and having a sports carnival.
At the time, intergenerational programs were far from mainstream, especially in Australia.

I joined the TV program with a panel of experts including a physiotherapist and psychologist.
We screened the older adults at the start of the experiment for issues such as depression, and assessed signs of physical frailty including speed of walking, muscle strength and activity levels. We then assessed them again after six weeks.
While we were cautiously hopeful, the overall improvements were better than anticipated, and some of the individual transformations were extraordinary.
For instance, three of four participants who originally screened positive for depression had scores in the normal range by the end of the program. For one woman in her 80s her score improved by eight points on a 15-point scale. Improvements in fitness levels across the group were impressive too.

Since then, the series has evolved to involve differing populations: from residents of aged care facilities and retirement villages, to older adults living in the community, and from preschoolers to teenagers.
Each program has been adapted to the needs of each group involved. At times, we have focused on a particular issue, such as loneliness, depression, concerns about memory, physical frailty and falls.
But in each we have continued to see benefits for both age groups, in line with what a growing evidence base is telling us about the potential benefits of such programs.
This is perhaps even more so in the Old People’s Home for Teenagers series, with the second season currently on air. The teenage participants are articulate in describing how truly valuable it is for younger people to spend enriched time with older mentors. Their confidence increases, they take on new challenges, and new meaningful connections develop, many of which continue to enrich lives long after the cameras stop rolling.
No-one is pretending such intergenerational programs are going to end loneliness for all older people, or can remove all the challenges they may face later in life. And equally, people do not need to be lonely, frail or isolated to participate.
Alongside the TV programs, there has been an upswing in community interest in intergenerational practice, from researchers to educators to aged care providers, to hospitals/health services and schools.
We need continued investment into workforce training, support for such programs to develop, and robust evaluation of each program to ensure they meet the goals of all the stakeholders involved – especially those of the participants themselves.
The “Old People’s Home” model did not invent the concept of intergenerational programs. Nor are the models of practice used in each series the only way intergenerational programs must run. But they do demonstrate what intergenerational programs could achieve.
Learn more about intergenerational programs in Australia and find one near you. If this article has raised issues for you, or if you’re concerned about someone you know, call Lifeline on 13 11 14.![]()
Stephanie Ward, Senior Research Fellow, Centre for Healthy Brain Ageing (CHeBA), UNSW Sydney
This article is republished from The Conversation under a Creative Commons license. Read the original article.
RSL NSW State Congress Congratulations
The Meritorious Service Medal is the highest honour which can be bestowed upon a Service Member of the RSL. All recipients must have at least 25 years continuous RSL membership, and given at least 25 years outstanding service to the League;The first Meritorious Service Medal is presented to Mr Robert Durbin from the War Veterans Village (Narrabeen) RSL sub-Branch.Mr Durbin served in the Royal Australian Navy for 20 years after enlisting in 1970. After discharge from the Navy, he joined the City of Blacktown RSL sub-Branch in 1990, were he remained a member for 27 years. During this time he held various positions including pensions officer, secretary, welfare officer, chaplain, president and far western metropolitan district council secretary, welfare officer and pensions officer. Mr Durbin also served at secretary of the City of Parramatta RSL sub-Branch from 2000 to 2010.In 1996, Mr Durbin became the Operations Manager at ANZAC House, a position he held until 2000. He then went on to be a State Councillor at RSL NSW for 14 years, where he was also the RSL Corps of Guards Chaplain during this time.Now a member of the War Veterans Village (Narrabeen) RSL sub-Branch, Mr Durbin has been the President since transferring in 2017 and is also one of two chaplains at this sub-Branch. It is estimated Mr Durbin has delivered over 800 tributes at funerals during his time as a member of the League.Mr Durbin has always had a passion for the motto of “Mates Helping Mates” and would ensure not only were his tributes delivered within the RSL protocol but also by honouring the wishes of the family. Such is his commitment to delivering funeral tributes, he started offering RSL funeral workshops for other sub-Branches, something he continues to do.Mr Durbin also serves as Chaplain to the Guardians of the Korean War Memorial New South Wales, HMAS Sydney Association, Tingara Australian Association and the Friends and Family of the First AIF Association.Not only has Mr Durbin been instrumental delivering local commemorations during his time as a secretary of the City of Parramatta RSL sub-Branch, he has also been involved in other local community events including Australia Day.In 2006, Mr Durbin was awarded Life Membership of the League and received an Australia Day Medal in 2008.

Ecotherapy Walks Available In Warriewood - Narrabeen
- Connect with nature to feel grounded and calm
- Increase your ability to access creative thinking to help with important decision making
- Understand the science – calming the nervous system and accessing the brains prefrontal cortex
- Connecting to place and understanding that we are ‘a part’ of the earth not ‘apart’ from it
- Mindful connection to the earth helps reduce feelings of anxiety, stress, fear, and depression
- Mindful connection promotes feelings of joy, creativity, strength, and resilience
- Totally free and easily accessible form of (self-guided) therapy to increase wellbeing
The Beatles - Now And Then - The Last Beatles Song (Short Film)
Now And Then: The Beatles
Why Seniors Need To Know About Gaslighting
"Psychological manipulation of a person usually over an extended period of time that causes the victim to question the validity of their own thoughts, perception of reality, or memories and typically leads to confusion, loss of confidence and self-esteem, uncertainty of one's emotional or mental stability, and a dependency on the perpetrator."
- “Your memory is starting to go.”
- “You’re going mad in your old age.”
- “That never happened, you’re crazy.”
- They owe something to the abuser.
- They cannot live without the abuser.
- They should feel guilty for doing something or not doing something.
- Everyone except the abuser is against them.
- Spending the victim’s money without permission.
- Misusing an Enduring Power of Attorney.
- Making important financial decisions without consulting the victim.
- Telling the victim they are too old to manage their own finances.
Should people who had disability before they turned 65, be allowed to become NDIS participants after 65? We asked 5 experts

The question of whether there should be an age limit to joining the National Disability Scheme (NDIS) has been debated since its inception a decade ago.
It is being asked again as we wait for the NDIS Review to release its final report. The report is expected to explore eligibility, sustainability and how costs should be split between the scheme and other government departments to provide an ecosystem of supports for people with disability.
Currently, once someone turns 65 they are no longer eligible to apply for NDIS support, even if they had disability before then. (NDIS support can extend beyond 65 for people who are already participants in the scheme.) Some people and groups say this is discriminatory.
So, should people who had disability before they turned 65, be allowed to become NDIS participants after 65? We asked five experts.
Four Out Of Five Said Yes
Disclosure statements: Elizabeth Kendall does not work for, consult, own shares in or receive funding from any company or organisation that would benefit from this article, and has disclosed no relevant affiliations beyond their academic appointment; Helen Dickinson receives funding from the Australian Research Council, National Health and Medical Research Council and Children and Young People with Disability Australia; Henry Cutler currently sits on the Investment Effectiveness Program Academic Advisory Panel for the National Disability Insurance Agency; Kathy Boschen was formerly a senior compliance officer for the NDIS Quality and Safeguards Commission, an advisor for the NDIA Administrative Appeals Tribunal Team, and an NDIA subject matter expert on mental health access; Mark Brown is an Honorary Research Fellow at La Trobe University and a Senior Research Fellow at the Summer Foundation. He is also an NDIS participant.![]()
Lucy Beaumont, Health + Disability Editor, The Conversation
This article is republished from The Conversation under a Creative Commons license. Read the original article.
Great Fire of London: how we uncovered the man who first found the flames

If you had been in London on September 2 1666, the chances are you’d remember exactly where you were and who you were with. This was the day the Great Fire began, sweeping across the city for almost five days.
The Museum of London is due to open a new site in 2026. And in preparation for this, curators of the Great Fire gallery decided to examine the stories of everyday Londoners.
As I’d been working with the museum on a project about teaching the Great Fire in schools, I was asked by Meriel Jeater, curator of the Great Fire displays, if I could help research the lives of these Londoners. Top of our list for investigation were the residents of Thomas Farriner’s bakery in Pudding Lane, where the fire began.
There has been lots of excellent work on the Great Fire but, because of ambiguities in the surviving sources, historians have different conclusions about who was in the bakery. Farriner, his wife, children and anonymous servants were among the people mentioned in modern accounts. But it was quickly clear I needed to go back to the manuscript evidence to find answers.
Two types of official investigation into the fire’s causes were carried out in 1666: a parliamentary enquiry and the trial of Robert Hubert, a Frenchman who had falsely confessed to starting the blaze. While you might think Londoners would have a keen interest in who was there at the start of the fire, the surviving accounts of exactly who was present are fragmentary.
Full reports from the enquiries were not published. Meanwhile, most writers at the time were, understandably, much more concerned with the fire’s destructive power than describing its beginnings.
As a result, the clearest account of events in the bakery is in a letter from an MP, Sir Edward Harley, reporting what he had heard. It’s now in the British Library, and was written in October 1666, when the two investigations into the fire were underway:
The Baker of Pudding Lane in whose hous ye Fire began, makes it evident that no Fire was left in his Oven … that his daughter was in ye Bakehous at 12 of ye clock, that between one and two His man was waked with ye choak of ye Smoke, the fire begun remote from ye chimney and Oven, His mayd was burnt in ye Hous not adventuring to Escape as He, his daughter who was much scorched, and his man did out of ye Windore [window] and Gutter.
Narrowing Down The Suspects
Other details in Harley’s letter suggested he was reliably reporting what he’d learned. The letter provides a list of bakery residents: Thomas Farriner, his unmarried daughter (Hanna), his “man” (meaning trained workman, aka journeyman) and his maid, who died. Other reports don’t mention the “man” or maid, but put Farriner’s son in the bakery.
A document in the London Metropolitan Archives provided more clues. This records the charges against Robert Hubert and – crucially – the names of seven witnesses against him. At the end were: “Thomas Farriner senior, Hanna Farriner, Thomas Dagger, Thomas Farriner Junior”.

Given that Thomas Dagger was sandwiched between the Farriners, Jeater and I suspected that he might be an unrecognised member of the household. Testing this theory, I was able to establish that the indictment’s list of names began with two men who had heard Hubert’s confession and a third who possibly had. The later names, starting with Thomas senior, appeared to be people who could testify to circumstances in the bakery.
This was exciting, because Thomas Dagger looked like a candidate for Farriner’s “man” in Harley’s account, potentially putting a name to the first reported witness of the Great Fire. Searching online archives, I could see there was a baker named Thomas Dagger running a business in Billingsgate after the fire and having many children. But we needed evidence to put Dagger in Pudding Lane.
Sleuthing In The Archives
Fortunately, the Bakers’ Company records had not gone up in smoke like so many other guild documents did in September 1666. So I went sleuthing at the Guildhall Library, comparing Bakers’ company information on Farriner’s workforce to names on the indictment.
After much squinting at microfilms, this produced firm evidence for two young men. Thomas Farriner junior had joined the Bakers’ Company in 1669, claiming that right through his father. I was delighted to find Thomas Dagger had indeed worked for Farriner too. He came from Norton in Wiltshire and had been apprenticed to another baker in 1655 before serving out his apprenticeship at Pudding Lane.

That nine-year apprenticeship (unusually long), had ended in 1664, so at the time of the fire he’d stayed on, working unofficially as a journeyman. Of all the names on the indictment, Dagger most clearly matched the description of the man who first discovered the fire.
Continuing the 17th-century investigations into the Great Fire was intriguing, but it’s how the bakery residents’ stories are told that matters. One of the great things about having the life stories of people such as Thomas Dagger is that it will help make the history of London more relevant to young visitors.
For example, if you’re a school child from Wiltshire learning about the Great Fire, Thomas Dagger’s presence in the bakery suddenly makes that national history part of your local history.
As a low-status journeyman, Dagger’s name wasn’t memorable to people in 1666 – he’s barely mentioned in the sources. But the hope is that he and others like him might become memorable to visitors to the new London Museum.
The new research will enable the displays to better represent the Farriner household and provide a fuller understanding of this pivotal moment in London’s history.

Looking for something good? Cut through the noise with a carefully curated selection of the latest releases, live events and exhibitions, straight to your inbox every fortnight, on Fridays. Sign up here.![]()
Kate Loveman, Professor of Early Modern Literature and Culture, University of Leicester
This article is republished from The Conversation under a Creative Commons license. Read the original article.
‘Cheap police’: Four Corners shows the dangers of private policing in the NT and why First Nations people are more at risk

Aboriginal and Torres Strait Islander readers are advised this article contains names of deceased people and mentions of discrimination and violence against First Nations people.
The most recent ABC Four Corners episode, Guarded, investigates the increase of private policing and security in the Northern Territory. It also shows scenes of First Nations people being deprived of their liberty, searched and assaulted by private security.
The prevalence of private police in the Northern Territory is on the pretence that crime has increased, although statistics from the Australian Bureau of Statistics based on public safety surveys between 2005 and 2023 and police data show mixed trends.
Despite the large scale of this kind of policing in the NT, there is a lack of legislation controlling what powers and authority private security guards actually have. There is also a lack of legislation regulating their conduct and responsible use of force and weapons.
The 4 Corners program documents instances of First Nations women, men and children being moved on, manhandled and pushed to the ground for prolonged periods by private security. In one month alone, 283 people were moved on. First Nations rough sleepers were especially targeted as part of a street sweeping agenda. One First Nations man described being thrown to the ground so badly he couldn’t breathe.
The report showed in 2013, Yanyuwa and Garrwa man Mr King died from positional asphyxia after security guards pushed him to the floor face down for seven minutes, during which he screamed “I can’t breathe”. The coroner into Mr King’s death found the security guards had insufficient training to understand the risks of their work. The guards were acquitted of manslaughter in 2014.
Private Policing In Australia
In 2023, the federal government and Northern Territory government announced $14.2 million in funding for additional police and private security, including ten security guards in public places in Alice Springs (Mparntwe), such as around youth centres.
Private police and security exercise enforcement roles, including apprehending, searching and detaining members of the public. In recent years across the country, the functions of private security have expanded from commercial and private spaces into patrolling public spaces, schools, transport platforms and interchanges, and on-board buses.
In the Northern Territory, private security patrols supplement the highest police-to-public ratio in the country.
This increase of private security in public spaces has not been accompanied with legislative authority to stipulate their powers. Rather, the increase of this mode of policing has transpired through government announcements and answers to questions in parliament in relation to their role.

What’s Happening In The Northern Territory
In Darwin (Garramilla), community lawyers have said that racism was evident in the operations by private security guards, noting their particular surveillance of First Nations people.
In Alice Springs, private security have taken a front-line role in the management of First Nations young people. In 2019, the Northern Territory government introduced its Breaking the Cycle of Youth Crime program, which included funding nightly security patrols operated by Talice Security throughout the CBD.
Doctoral research by Lora Chapman finds that in Alice Springs, private security patrols are “stand-ins for police” and make it difficult for First Nations young people to be free from surveillance. First Nations young people could not enter the weekly youth disco, for instance, without providing their names and addresses to security officers and being scanned by metal detectors. They were then locked in the disco, where Chapman described First Nations kids feeling under siege.
Private security guards in the Northern Territory also possess restricted weapons. In Alice Springs, private security transit officers and crowd controller licence holders can carry oleoresin capsicum spray (also known as “OC” or “pepper spray”), while lacking necessary training. This weapon can cause coughing fits, breathing difficulties and fatalities.
What Are The Risks Of Private Policing?
There is no legal framework to restrain the power of private security guards, and the scope of their powers is completely obscure. The detail is often buried in contractual agreements or licences between private security contractors and the government.
It was shown on 4 Corners that people experiencing homelessness in Darwin submitted to the authority of security officers without being told of the scope of their powers.
When violence is inflicted by a Northern Territory security officer, the complaints procedure, at best, provides for the suspension of licences, rather than referrals to police. The 4 Corners program reported that many security officers shown in videos to be manhandling First Nations people were able to retain their licences.
In the NT, there is a private security act that seeks to regulate security services, but it only relates to the provision, review and suspension of licences, rather than the powers exercised by private security guards. When this act was first introduced to parliament, it was envisaged a legislative amendment would be required to address this. This has not yet occurred.
Police powers and authority are governed by legislation, which has been sorely tested by ongoing police assaults and deaths in police custody.
Governments need to not only better regulate policing and private security guards, they should also establish independent oversight of all policing. Governments should also consider alternatives to policing, such as Aboriginal night patrols that promote care and safety for community.

Profits Before People
The privatisation of public order management and policing creates a law enforcement system driven by profits. Profits are a deterrent to investing in staff training, employing qualified guards and providing compliance systems. Providers in the Northern Territory, for instance, can meet the competency standards for a security officer within eight days.
Repeatedly on 4 Corners, First Nations people and security officers referred to the officers as “cheap police”. The commodification of public policing is based on cost efficiency, rather than a legislative framework and protection for the public.
The possession of weapons also opens the gates to unchecked violence. As the harms of Northern Territory policing mount, the focus should be on retracting rather than expanding the policing net.![]()
Thalia Anthony, Professor of Law, University of Technology Sydney
This article is republished from The Conversation under a Creative Commons license. Read the original article.
Bulk Billing Incentives Commence From November 1: Will Provide Crucial Support For GPs And Patients
 The Australian Medical Association welcomes significant increases to Medicare bulk billing incentives coming into effect today, providing much needed cost-of-living relief for millions of Australians.
Two Australian Native Bee Species Become One As Researchers Solve Identity Puzzle

Microplastics' Shape Determines How Far They Travel In The Atmosphere
Specific Gut Bacteria Increase Risk Of Severe Malaria
Women and low-income earners miss out in a superannuation system most Australians think is unfair

Most Australians think the superannuation system is unfair, with only one in three agreeing the retirement savings scheme is fair for most Australians, according to a survey conducted for the University of Melbourne.
In fact, only about half of those surveyed agreed superannuation works well for them.
These results contradict a conventional view based on earlier studies and held by academics and many in the personal finance sector, that Australians give little thought to superannuation.
A 2013 survey found Australians have poor knowledge of how the superannuation system works, while another study in 2022 highlighted low financial literacy in general.
Australians also showed little interest in superannuation, according to a 2020 Department of Prime Minister and Cabinet survey, with few Australians showing interest in reading their superannuation statements, choosing their fund or making voluntary contributions.

With Australian households seen as uninformed and uninterested, their opinions tend to be left out of the public debate. We hear much about the gender pension gap, for example, but little about what women actually think about superannuation.
Similarly, the distribution of tax advantage in superannuation is hotly debated by economists but survey data tends to refrain from asking households what they think about equity in the superannuation system.
The University of Melbourne survey of 1,003 Australians was undertaken by Roy Morgan Research in April.
Its results show women and low-income households are widely seen as disadvantaged in the superannuation system.
In fact, only one in five Australians see the superannuation system as well suited to the needs of women and of low-income households, while 70% believe super favours wealthy households.
This suggests although Australians may show little interest in the management of their super accounts and may report they find the system confusing or even boring, they are surprisingly aware of how superannuation is distributed.
Women, Singles And Low-Income Earners Miss Out
The federal government’s 2020 Retirement Income Review documents these gaps. Renters, women, uncoupled households and those on low-incomes fare poorly in the retirement income system.
With little super to supplement the public pension, these groups are vastly over-represented in elderly poverty statistics, which are among the highest in the OECD.
Mirroring the gaps in the superannuation system reported by the review, the University of Melbourne survey shows that it is outright homeowners and those who are married who believe the superannuation system works well.
Concerns the system works poorly for women and low-income households are strongest among women and low-income households. Only one in three renters believe the superannuation system meets their needs.
This suggests individuals’ concerns about fairness in the superannuation system are driven by their own experiences of disadvantage, regardless of financial literacy.
This is consistent with my own research into household attitudes to superannuation, which showed some resentment among women who were well aware their male partners had substantially higher superannuation balances than them.
This all matters for policymakers.
Why Public Perceptions Are Important
In the short term, these results suggest public support for making super fairer is likely to be stronger than previously thought. Recent government changes to tax concessions on large balances, for example, could have gone much further without losing support from the 70% of households that think the system favours the wealthy.
But it matters for the longer term too.
Public perceptions of fairness, effectiveness and efficiency are crucial to policy sustainability. This is well established in the academic literature from B Ebbinghaus, 2021 and H Chung et al., and accepted by the Retirement Income Review.
The review assessed the public’s confidence in the system to both “deliver an adequate retirement income for them(selves) and (to) generate adequate outcomes across society”.
As the review makes clear, the system must avoid a loss of public confidence from perceptions of unfairness.
Yet perceptions of unfairness are exactly what the University of Melbourne results suggest. This would have been clearer to policymakers if they asked earlier.![]()
Antonia Settle, Academic (McKenzie Postdoctoral Research Fellow), The University of Melbourne
This article is republished from The Conversation under a Creative Commons license. Read the original article.
Humans Are Disrupting Natural 'Salt Cycle' On A Global Scale New Study Shows
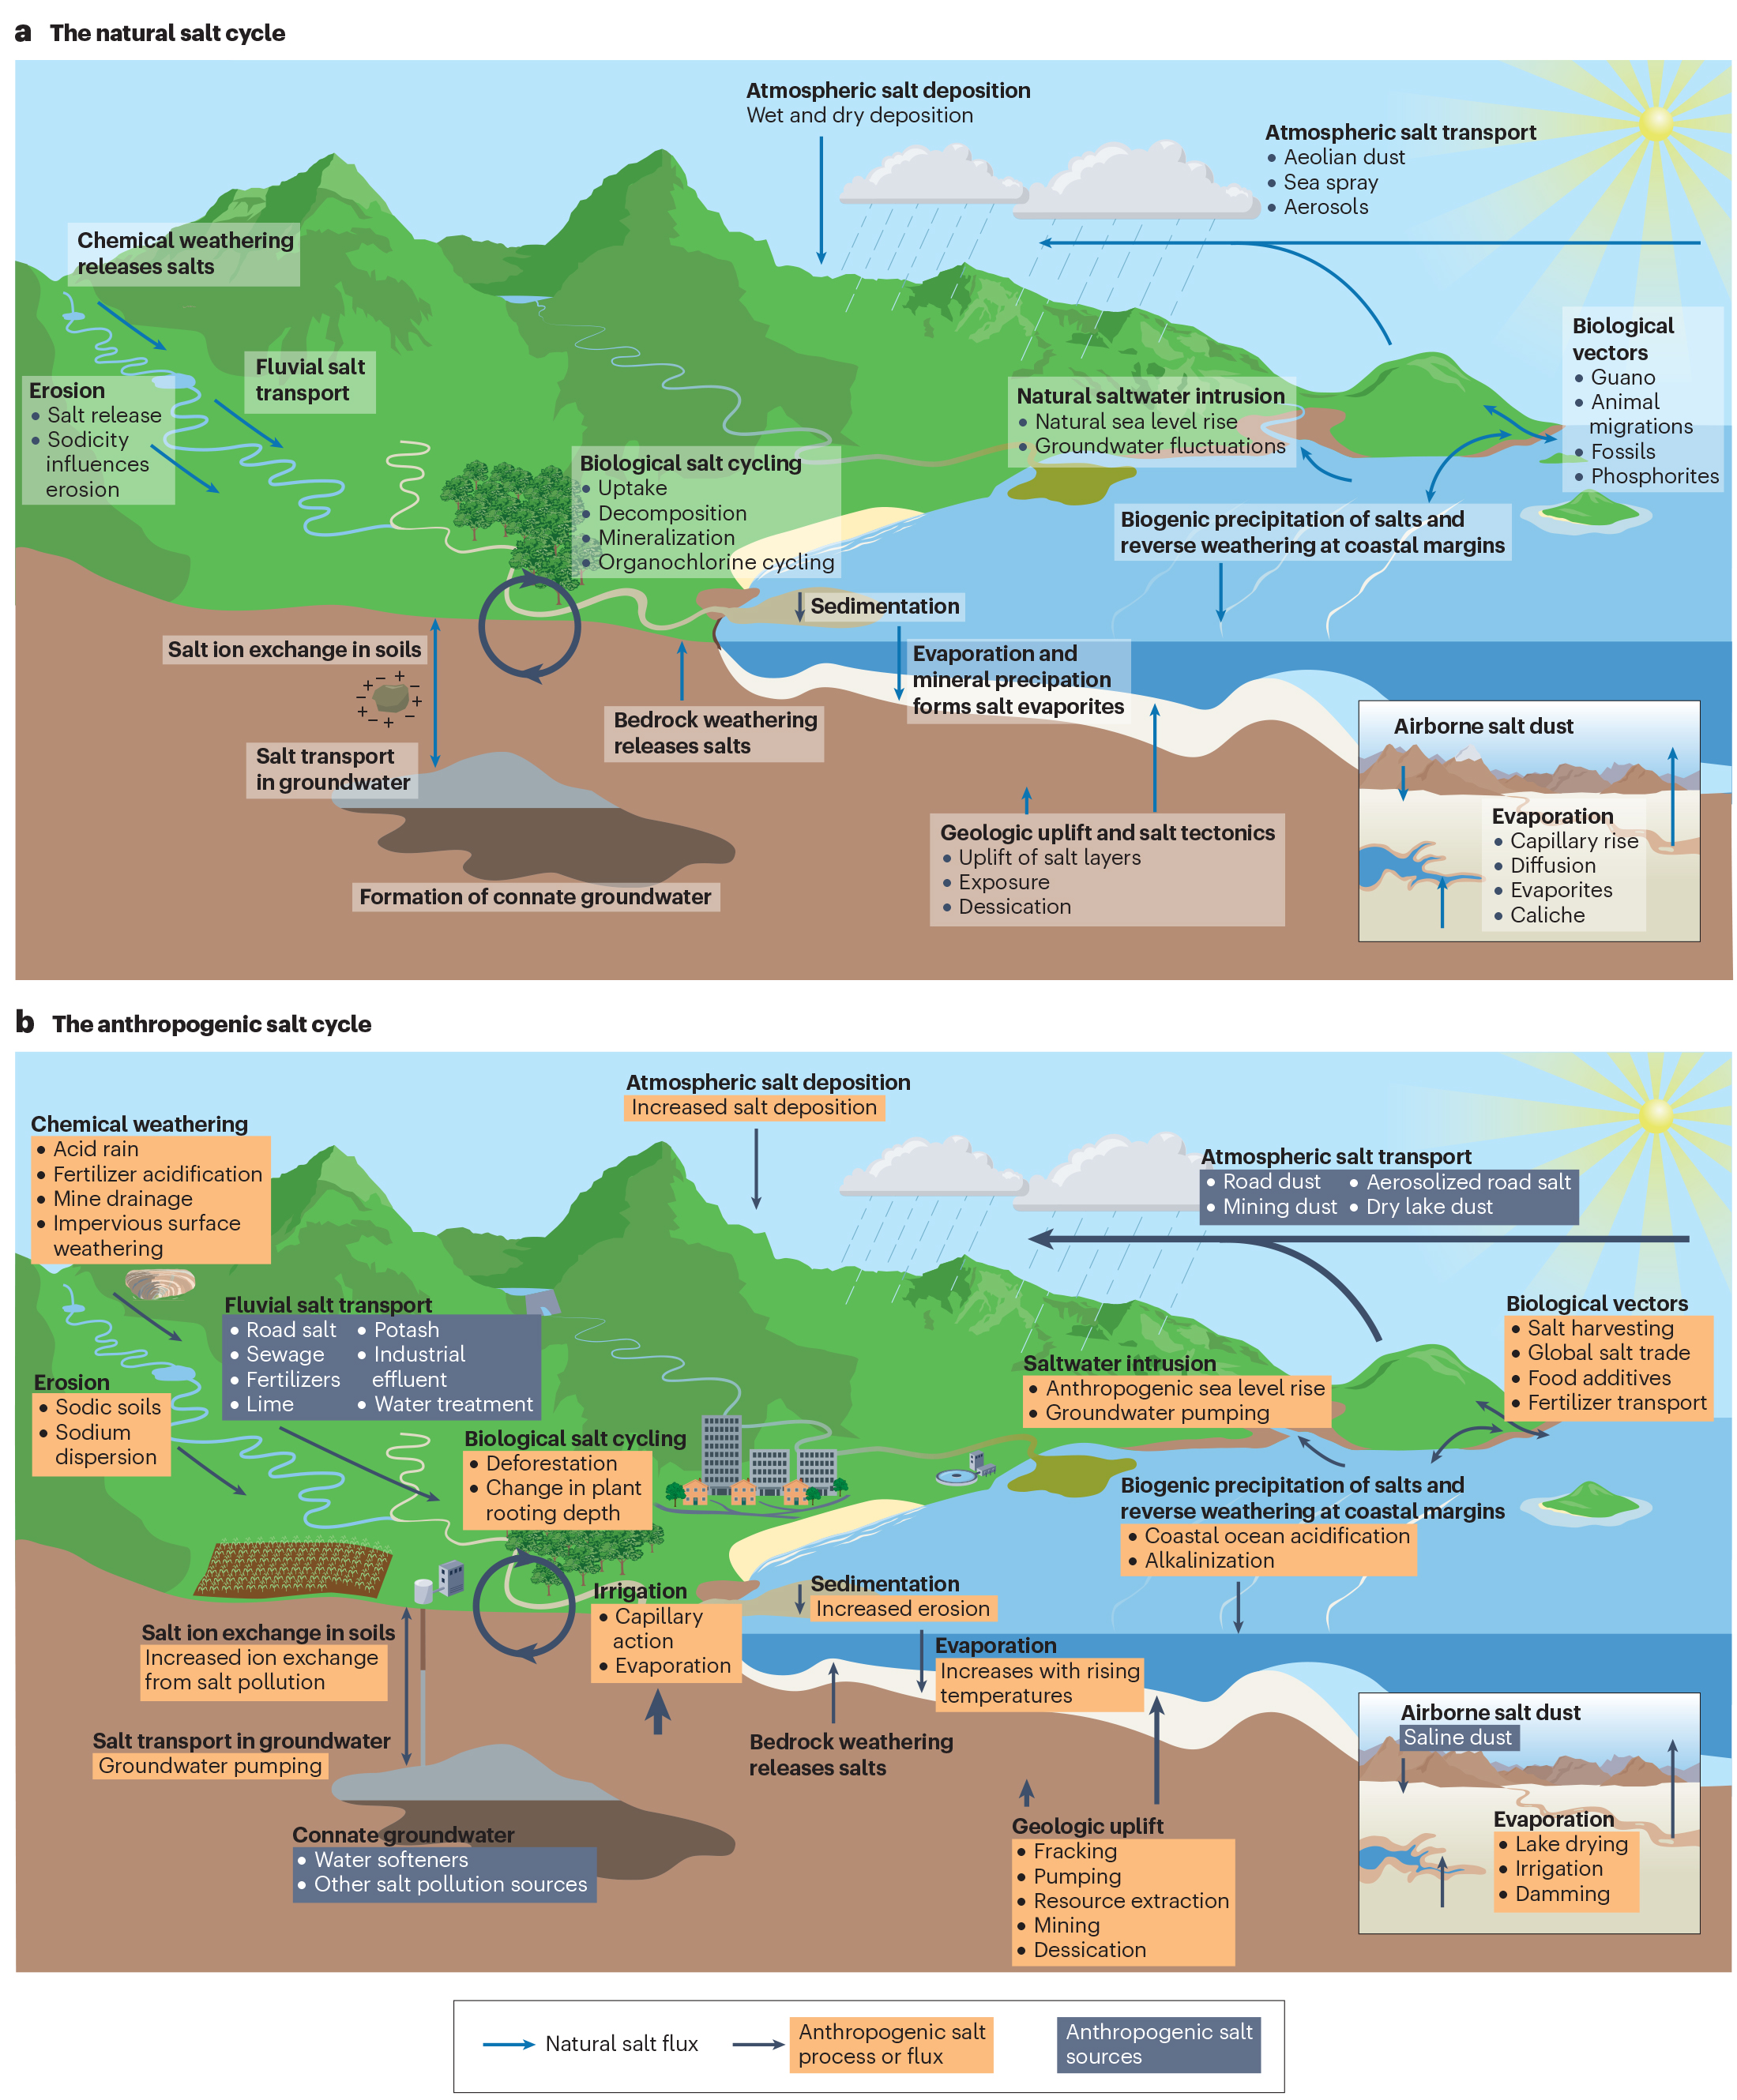
High Engagement, High Return: The Secret To Student Success
 High engagement, high return. That's the advice from education experts at the University of South Australia for teachers looking to improve student outcomes.
Disclaimer: These articles are not intended to provide medical advice, diagnosis or treatment. Views expressed here do not necessarily reflect those of Pittwater Online News or its staff.