Notes
EV Use in Pittwater
Data from the Australian Automobile Association records the use and proportion of all vehicles, by postcode, including ownership of BEV (Battery electric vehicle) and fuel vehicles. This data provides access and insights into how many EVs here are across the peninsula, although the news service only delved into Pittwater suburbs and those that were going to be discussed at the February 2025 council meeting for this report.
This association also records which vehicles are being purchased – and the amount of time it takes to recharge one. This ranges from 18 minutes (10% to 80%) for the smaller Kia models up to 80 minutes for the smaller Lexus.
Purchase of electric vehicles and hybrid vehicles is increasing in New South Wales, although the state ranks second across Australia behind the ACT. Visit: https://www.aaa.asn.au/research-data/electric-vehicle/
On Friday February 21 2025 the Australian Automobile Association released its latest data on EVs. Sales of hybrid vehicles continued to exceed those of electric vehicles in the last three months of 2024 despite losing market share amid a slowdown in car sales across the nation, according to the nation’s peak motoring body.
While the market share of hybrids fell from 16.70 per cent in the September quarter to 14.83 per cent in the December quarter, they still outsold EVs, which increased their market share to 7.42 per cent of sales – up from 6.59 per cent.
The new data comes in the AAA EV Index online data dashboard, which analyses all new light vehicle sales across the country. Its latest quarterly update shows the December quarter 2024 had the lowest light vehicle sales since the January quarter of 2023.
In national new light vehicle sales:
- total sales (all engine types) fell 0.62% (from 289,098 to 287,294)
- ICE sales rose by 0.63% and ICE market share rose from 74.17% to 75.11%
- battery electric vehicle sales rose 11.93% (from 19,057 to 21,331), which is still lower than the sales and market share achieved in the first half of 2024
- plug-in hybrid (PHEV) sales continued to rise – up 3.18% from Q3 with market share rising from 2.53% to 2.63%
2023-24 National Quarterly New Light Vehicle Sales*
Fuel type Q1 2023 Q2 2023 Q3 2023 Q4 2023 Q1 2024 Q2 2024 Q3 2024 Q4 2024
ICE 222,136 246,565 247,488 248,943 228,961 236,129 214,433 215,789
BEV 17,396 25,696 22,651 21,474 25,552 25,353 19,057 21,331
Hybrid 16,101 22,212 31,418 28,708 35,003 46,727 48,282 42,618
PHEV 1,461 2,071 3,211 4,476 3,426 4,675 7,323 7,556
HFCEV – – 2 4 2 5 3 0
All 257,094 296,544 304,770 303,605 292,994 312,889 289,098 287,294
2023-24 National Quarterly New Light Vehicle Market Share*
Fuel type Q1 2023 Q2 2023 Q3 2023 Q4 2023 Q1 2024 Q2 2024 Q3 2024 Q4 2024
ICE 86.40% 83.15% 81.20% 82.00% 78.16% 75.47% 74.17% 75.11%
BEV 6.77% 8.67% 7.43% 7.07% 8.72% 8.10% 6.59% 7.42%
Hybrid 6.26% 7.49% 10.31% 9.46% 11.95% 14.93% 16.70% 14.83%
PHEV 0.57% 0.70% 1.05% 1.47% 1.17% 1.49% 2.53% 2.63%
HFCEV 0.00% 0.00% 0.00% 0.00% 0.00% 0.00% 0.00% 0.00%
*Data courtesy Federal Chamber of Automotive Industries and Electric Vehicle Council
Hybrid sales fell in all states and territories, except for Tasmania. Nationally, they were down 11.73% from Q3 2024 (from 48,282 to 42,618). This reduction of 5,664 vehicles was largely due to weaker sales for Toyota, which were down 6,337 sales on Q3.
The figures cover the final three months before the Federal Government implemented its New Vehicle Efficiency Standard, which is designed to drive greater sales of EVs and more fuel-efficient vehicles. The scheme took effect in January, and reporting of its effects will start in July.
Trends
There have been significant quarterly fluctuations in car sales over the past two years, producing a clear trend of growth for hybrids but also indicating availability of Toyota models might have a significant impact on the hybrid market.
BEV sales and market share seem to have peaked for now, with both metrics still below their Q2 2024 records. The third and fourth quarters of 2024 featured lower total car sales than any of the preceding five quarters.
In the first half of 2023, BEVs outsold hybrids, but since then hybrids have outsold BEVs in six consecutive quarters. Hybrids are now outselling BEVs even in the ACT, which has long been Australia’s strongest BEV market.
PHEV sales are growing strongly, but from a low base. PHEV sales are strongest in the ACT (6.35% market share in Q4 2024). Tasmania and the NT had the lowest Q4 PHEV market shares – 1.32% and 1.48% respectively. The five largest states had PHEV market shares between 2.48% (in Queensland) and 2.80% (in Victoria), in line with the national market share of 2.63%.
Incentives and market share trends
Plug-in hybrids are currently exempt from fringe benefits tax, which can save buyers thousands of dollars when buying a new car under a novated lease. But this benefit will end in April 2025.
Government rebates for BEV purchases have now ceased in all states and territories, except Western Australia, which will cease this benefit in May.
Fuel types and vehicle types – Q4 2024
Medium SUVs remain Australia’s most popular vehicle segment. They dominate the hybrid, BEV and PHEV markets, but among ICE vehicles they are the fourth-most popular segment behind 4WD utes, small SUVs and large SUVs.
In the December quarter, more than half (69.95%) of new SUVs sold were ICE. About a fifth (19.34%) were hybrids; 6.61% were BEVs; and 4.10% were PHEVs. Of the 7,556 PHEVs sold in the December quarter, 5,962 (or 78.90%) were medium SUVs.
ICE vehicles still dominated all market segments except for medium cars, with 4,812 (58.05%) being BEVs, 22.52% ICE, 18.78% Hybrids and 0.64% were PHEVs.
ICE also accounted for most sales of small cars (67.67% market share in the December quarter) and large cars (64.99%).
More than 99% of utes and vans sold were ICE vehicles.
EV Index
The AAA EV Index quantifies Australia’s vehicle technology transition. It collates information from multiple national, state and territory sources, including information provided by the Federal Chamber of Automotive Industries and the Electric Vehicle Council, used with the FCAI’s and the EVC’s permission.
The Index is intended to enable consumers, businesses, and fleet managers to see the trends transforming the national vehicle market. Its online dashboard covers light vehicles of all fuel types.
For more information – including state and territory sales figures – see evindex.au
Globally, manufacturers have committed investment of more than $90 billion to bring new electric models to the market.
• Infrastructure Australia has identified that an EV charging network is a high priority.
• The NSW Government has released the NSW Electric and Hybrid Vehicle Plan which is a significant advancement in government policy in support of EVs and EV charging infrastructure. In relation to EV charging stations, the key actions include:
- - setting a 10 per cent target for new NSW Government general purpose passenger fleet cars from 2020/21 – with 10 per cent of new vehicles purchased or leased by agencies to be electric or hybrid vehicles
- - co-invest in fast chargers in regional NSW on major regional corridors (this is largely private sector driven)
- - co-invest in fast chargers in commuter car parks (this is largely private sector driven)
- - adopt preferred charging standards to guide councils, companies and investment
- - develop guidelines for the installation of charging points in roadside service centres
- - support EV charging through strategic land use planning and guides.
• The NSW Government (Transport for NSW) has developed the ‘NSW Electric Vehicle Charging Program’ which aims to facilitate and engage in partnerships between the public and private sector for the delivery of EV charging stations across metropolitan commuter carparks and key regional road networks.
As a result of this, in August 2021 the council adopted the Northern Beaches Electric Vehicle Charging Infrastructure Plan to guide the appropriate installation of EV charging infrastructure on the peninsula.
Under the current proposal JOLT, in consultation with Council, applied for a grant for the installation of 15 additional EV chargers through the NSW EV Kerbside Charging Grant program and was successful in receiving a grant.
Consequently, JOLT applied to Council to progress these locations for installation. As part of Council’s normal processes, community consultation was conducted to gauge the level of support for the proposed chargers.
The community and stakeholder engagement was conducted between 9 August and 8 September 2024 and consisted of a series of activities that provided opportunities for community and stakeholders to contribute.
NSW electric vehicle charging map
Available here: https://www.transport.nsw.gov.au/projects/electric-vehicles/charging-an-electric-vehicle/nsw-electric-vehicle-charging-map
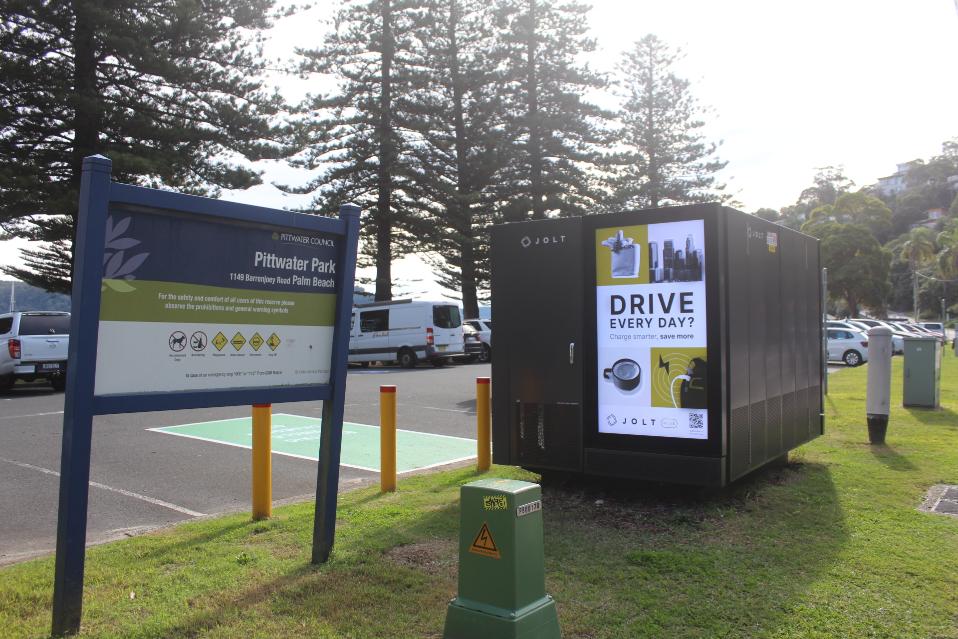
- JOLT Charging Station in Pittwater Park Palm Beach (opposite Barrenjoey House) - CHAdeMO· 25 kW and a CCS· 25 kW
- Exploren Charging Station at 13 Kalinya street Newport a Type 2 22Kw
- 2 x Jolt recharging stations at Mona Vale, one at 2 Bungan street the other at 1 Park street; CHAdeMO· 25 kW and a CCS· 25 kW
- Chargefox Charging Station at 12 Jacksons road Warriewood - CCS· 120 kW of 2/2 and one Type 2· 22 kW
- AmpCharge Charging Station at 1509-1511 Pittwater road North Narrabeen in the Ampol station - CCS· 150 kW1/1 and a CHAdeMO· 125 kW
NSW Cars:
- All fuels: 5,676,204
- ICE: 5,464,456
- BEV (battery Electric Vehicle): 49,768
- Hybrid / PHEV: 161,980
- HFCEV: 0
Forestville; Postcode 2087 (NSW)- (as of February 21, 2025)
- All fuels: 8,639
- ICE: 8,240
- BEV: 147
- Hybrid / PHEV: 252
- HFCEV0
All fuels Registrations 8639
- All fuels registrations — Postcode rank in country 794 out of 2635
- All fuels registrations — Postcode rank in state 234 out of 609
- All fuels registration penetration 100.00%
- All fuels registration penetration — Postcode rank in country 103 out of 2635
Brookvale; Postcode 2100 (NSW)
- All fuels: 18,026
- ICE: 17,272
- BEV: 263
- Hybrid / PHEV: 491
- HFCEV0
All fuels Registrations 18026
- All fuels registrations — Postcode rank in country 319 out of 2635
- All fuels registrations — Postcode rank in state 99 out of 609
- All fuels registration penetration 100.00%
- All fuels registration penetration — Postcode rank in country 114 out of 2635
- All fuels registration penetration — Postcode rank in state 80 out of 609
Narraweena: Postcode 2099 (NSW)
- All fuels: 27,295
- ICE26,171
- BEV263
- Hybrid / PHEV: 861
- HFCEV0
All fuels Registrations 27295
- All fuels registrations — Postcode rank in country 135 out of 2635
- All fuels registrations — Postcode rank in state 38 out of 609
- All fuels registration penetration 100.00%
- All fuels registration penetration — Postcode rank in country 113 out of 2635
- All fuels registration penetration — Postcode rank in state 79 out of 609
Manly: Postcode 2095 (NSW)
- All fuels: 9,249
- ICE 8,819
- BEV: 182
- Hybrid / PHEV: 248
- HFCEV0
All fuels Registrations 9249
- All fuels registrations — Postcode rank in country 751 out of 2635
- All fuels registrations — Postcode rank in state 223 out of 609
- All fuels registration penetration 100.00%
- All fuels registration penetration — Postcode rank in country 110 out of 2635
- All fuels registration penetration — Postcode rank in state 76 out of 609
Dee Why (which has 5 charging stations): Postcode 2099 (NSW)
- All fuels: 27,295
- ICE: 26,171
- BEV: 263
- Hybrid / PHEV: 861
- HFCEV0
All fuels Registrations 27295
- All fuels registrations — Postcode rank in country 135 out of 2635
- All fuels registrations — Postcode rank in state 38 out of 609
- All fuels registration penetration 100.00%
- All fuels registration penetration — Postcode rank in country 113 out of 2635
- All fuels registration penetration — Postcode rank in state 79 out of 609
Compare Pittwater postcodes (as of February 21, 2025):
Postcode 2108 (NSW) - Palm Beach and surrounds (Mackerel Beach, Whale Beach), bearing in mind the thousands of visitors that drive here annually
- All fuels: 1,497
- ICE: 1,411
- BEV: 42
- Hybrid / PHEV: 44
- HFCEV0
All fuels Registrations 1497
- All fuels registrations — Postcode rank in country 1647 out of 2635
- All fuels registrations — Postcode rank in state 474 out of 609
- All fuels registration penetration 100.00%
- All fuels registration penetration — Postcode rank in country 122 out of 2635
- All fuels registration penetration — Postcode rank in state 88 out of 609
Postcode 2107 (NSW)- Avalon Beach, Clareville, Careel Bay
- All fuels: 11,656
- ICE: 11,180
- BEV: 215
- Hybrid / PHEV: 261
- HFCEV0
All fuels Registrations 11656
- All fuels registrations — Postcode rank in country 596 out of 2635
- All fuels registrations — Postcode rank in state 176 out of 609
- All fuels registration penetration 100.00%
- All fuels registration penetration — Postcode rank in country 121 out of 2635
- All fuels registration penetration — Postcode rank in state 87 out of 609
Postcode 2106 (NSW) - Newport
- All fuels: 7,279
- ICE7,013
- BEV: 99
- Hybrid / PHEV: 167
- HFCEV0
All fuels Registrations 7279
- All fuels registrations — Postcode rank in country 916 out of 2635
- All fuels registrations — Postcode rank in state 270 out of 609
- All fuels registration penetration 100.00%
- All fuels registration penetration — Postcode rank in country 120 out of 2635
- All fuels registration penetration — Postcode rank in state 86 out of 609
Postcode 2105 (NSW)
- All fuels: 1,517
- ICE: 1,438
- BEV: 41
- Hybrid / PHEV: 38
- HFCEV0
All fuels Registrations 1517
- All fuels registrations — Postcode rank in country 1641 out of 2635
- All fuels registrations — Postcode rank in state 472 out of 609
- All fuels registration penetration 100.00%
- All fuels registration penetration — Postcode rank in country 119 out of 2635
- All fuels registration penetration — Postcode rank in state 85 out of 609
Postcode 2104 (NSW)
- All fuels: 2,973
- ICE: 2,838
- BEV: 62
- Hybrid / PHEV: 73
- HFCEV0
All fuels Registrations 2973
- All fuels registrations — Postcode rank in country 1367 out of 2635
- All fuels registrations — Postcode rank in state 401 out of 609
- All fuels registration penetration 100.00%
- All fuels registration penetration — Postcode rank in country 118 out of 2635
- All fuels registration penetration — Postcode rank in state 84 out of 609
Postcode 2103 (NSW)
- All fuels: 8,503
- ICE: 8,180
- BEV: 121
- Hybrid / PHEV: 202
- HFCEV0
All fuels Registrations 8503
- All fuels registrations — Postcode rank in country 810 out of 2635
- All fuels registrations — Postcode rank in state 240 out of 609
- All fuels registration penetration 100.00%
- All fuels registration penetration — Postcode rank in country 117 out of 2635
- All fuels registration penetration — Postcode rank in state 83 out of 609
Postcode 2102 (NSW)
- All fuels: 6,374
- ICE6,165
- BEV: 71
- Hybrid / PHEV: 138
- HFCEV0
All fuels Registrations 6374
- All fuels registrations — Postcode rank in country 980 out of 2635
- All fuels registrations — Postcode rank in state 290 out of 609
- All fuels registration penetration 100.00%
- All fuels registration penetration — Postcode rank in country 116 out of 2635
- All fuels registration penetration — Postcode rank in state 82 out of 609
Postcode 2101 (NSW)
- All fuels: 14,133
- ICE: 13,721
- BEV: 148
- Hybrid / PHEV: 264
- HFCEV0
All fuels Registrations 14133
- All fuels registrations — Postcode rank in country 451 out of 2635
- All fuels registrations — Postcode rank in state 134 out of 609
- All fuels registration penetration 100.00%
- All fuels registration penetration — Postcode rank in country 115 out of 2635
- All fuels registration penetration — Postcode rank in state 81 out of 609
Council Report on New EV Charging Sites
Council's consultation shortlisted 13 sites - there is funding to install 11 under the current NSW Government Kerbside EV Charging grant, plus an additional two in lieu of previously approved sites that are no longer feasible.
Proposed locations were:
- Avalon Beach Carpark - 558A Barrenjoey Road, Avalon Beach
- Balgowlah Shops Carpark - 187 Condamine Street, Balgowlah
- Outside 19 Sydenham Road, Brookvale
- Outside 27 Mitchell Road, Brookvale
- Outside 16 Fisher Road, Dee Why
- Fairlight Shops - Sydney Road, Fairlight (at Hilltop Crescent)
- Forestville Seniors Centre Carpark 1 - Starkey Street (corner of Warringah Road), Forestville
- Forestville Seniors Centre Carpark 2 - Starkey Street (corner of Warringah Road), Forestville
- West Esplanade - opposite 75 West Esplanade, Manly
- Victoria Parade - outside 29 East Esplanade, Manly
- Narraweena Shops Carpark - 52 May Road, Narraweena
- Outside 327 Barrenjoey Road, Newport
- Battle Boulevarde (Spit Bridge) Carpark, Seaforth
- Sturdee Parade, Dee Why - replacing Oaks Avenue (cnr The Strand), Dee Why**
- South Steyne, Manly - opposite side of the street from the previous proposal**.
**These two sites replace two that had been approved in 2023 but can no longer go ahead.
The council report tabled on the same also found several other locations were ‘not supported’;
- 187 Condamine Street, Balgowlah - Not feasible; Cost prohibitive for the provider
- Outside 27 Mitchell Road, Brookvale Not supported Proximity to 19 Sydenham Road site, volume of traffic
- Outside 16 Fisher Road, Dee Why Not supported Proximity to Pittwater Road, limited footpath, traffic, and parking impact
- Fairlight Shops Sydney Road, Fairlight (at Hilltop Crescent) Not supported Alternate location nearby could be considered, subject to further investigation and removal of advertising
- Starkey Street (corner of Warringah Road), Forestville Not supported Proximity to high pedestrian demand area and bus infrastructure
- Opposite 75 West Esplanade, Manly Not supported Advertising and parking demand issues
- Battle Boulevarde (Spit Bridge) Carpark, Seaforth Not supported Proximity to Manly Road site, limited community use, and existing parking spaces
- Sturdee Parade Sturdee Parade, Dee Why Not supported Advertising, residential amenity, and parking demand issues
- South Steyne, Manly Not supported Advertising, footpath clutter, and parking demand issues
Council states feedback was captured through a social map that asked people to vote thumbs up or thumbs down on each of the proposed locations. An online comment form was also embedded onto the have your say project page. The form included an open-field comments box, providing community members a space to explain or elaborate on their support, not support or neutral sentiment as well as any other feedback they wished to contribute.
The key themes from the engagement process were cost and community need, locations, commercial interests, advertising, planning approval, charger type, social, enforcement, economic, and environmental.
Primary reasons for support were the expected environmental benefits of promoting electric vehicle adoption, along with addressing the potential future demand. Many respondents indicated that, while they support the provision of infrastructure, the council needed to make further minor changes or additions to ensure that the locations are sustainable, effective and not impacting on key locations.
Many felt the proposal did not provide enough EV charging stations in locations across the peninsula. Specific charging station locations, including tourist destinations (to encourage visitors) and at the beach carparks were also mentioned.
Positive submissions called for:
- more locations to be considered for chargers to be installed, without advertising, to bring more competition into the area
- fast chargers to be installed to maximise the use of the infrastructure
- a wider range of locations to allow residents without access to home charging options to access public chargers
- more chargers be installed in car parks rather than on street spaces.
- Key concerns raised were:
- the cost to Council for the dedicated sites compared with the limited fees paid by the provider
- the locations removing parking for other users
- visual clutter and the significant impact of the advertising on local amenity
- safety concerns around the locations near residential buildings.
Council's report states feedback themes also showed community concerns were raised regarding locations due to the advertising component of the proposal, with site selection appearing to be more about the location for an advertising return rather than community need for charging at the proposed locations.
Compatibility issues and charging levels preference were also raised. These respondents wanted to ensure that all models of cars would be able to use the charging stations and that ultra-rapid chargers (aim for 50kw) were the preferred option.
A majority of respondents questioned the need for advertising on the infrastructure and supported pole mounted, or discrete charger options without advertising which they saw as detrimental to the local environment, or a privatisation of public space.
Several respondents indicated that the charging stations should be a user pays system, or the EV manufacturer should pay for the charging infrastructure. They expressed that Council should not be involved with providing free charging for a small minority of people with electric vehicles. Other respondents noted that there were not enough EVs on the peninsula currently to warrant the expenditure for charging infrastructure or that it was a waste of ratepayers’ money.
In the current 2024/25 adopted fees and charges, Council charges an application fee of $1,619 per EV location. This covers the cost of staff time assessing the location, undertaking the necessary community engagement and reporting to the Northern Beaches Council Local Traffic Committee, along with the preparation of the any work instructions required to install the signage and line-marking component of the site.